Most poultry farmers track body weight, mortality, and days to slaughter. The farmers consistently generating the highest margins track one number above all others: feed conversion ratio.
FCR is the weight of feed consumed divided by the weight of live gain produced. A bird that consumes 1.6 kg of feed to produce 1 kg of live weight has an FCR of 1.6. Improve that to 1.5, and you have saved 100g of feed for every kilogram of meat — a 0.1 improvement that sounds trivial until you run the farm-scale numbers.
On a 10,000-bird farm targeting a 2.5 kg average live weight, the flock produces 25,000 kg of meat per cycle. An FCR improvement of 0.1 saves 100g of feed per kilogram of meat — 2,500 kg of feed per cycle, or 2.5 tonnes. At a commercial feed price of $0.50 per kilogram, that is $1,250 saved per cycle without changing your genetics, your house, or your stocking density. Run six cycles per year, and that single management improvement generates $7,500 in annual feed cost reduction from one house.
The number compounds further when you recognise that most farms are not sitting at 1.6 FCR because of feed quality or genetics. Industry data consistently shows that FCR is approximately 40% genetics and 60% management. The five strategies in this article address the management 60% — the portion entirely within your control, requiring no capital investment in breed upgrades or feed reformulation.
Strategy 1 — The Feed-to-Water Ratio Rule
The Biology
Feed digestion is a water-dependent process at every stage. Salivary enzyme activity, gastric acid production, intestinal absorption across the villi surface, and the transit of digesta through the gut all require adequate hydration. When water intake drops, the digestive process does not simply slow down proportionally — it becomes selectively inefficient. Dry feed in a water-deficient gut sits longer, ferments rather than digests, and passes partially unabsorbed. The bird has consumed the feed and generated the metabolic cost of eating it, but captured a fraction of the available nutrients. FCR worsens not because the bird ate less, but because it converted what it ate less efficiently.
The Standard
At an ambient temperature of 21°C, a broiler should be consuming water and feed at a ratio of approximately 1.8 litres of water per kilogram of feed. This is the baseline for efficient digestion. In tropical or hot-season conditions above 28°C, this ratio rises to 2.2–2.5:1 as the bird uses water for thermoregulation in addition to digestion. If you are monitoring feed consumption but not water consumption, you are missing the variable that governs how efficiently that feed is converted.
Measure water consumption at the header meter daily. Establish your baseline ratio in the first week of a batch and track deviations. A sudden drop in water-to-feed ratio — even without any change in visible bird behavior — is an early warning of line blockage, water temperature problems, nipple failure, or the onset of a health challenge. Catching it on Day 10 costs you far less than discovering the FCR consequence at Day 42 weigh-out.
The Line Quality Factor
A point most FCR discussions omit entirely: dirty or biofilm-contaminated drinker lines reduce water palatability and voluntary intake measurably. Broiler drinker lines that are not flushed and sanitized between batches accumulate bacterial biofilm — a microbial mat that imparts taste and odor compounds to the water flowing through it. Birds do not drink dirty water enthusiastically. They “pick” at it — taking small sips rather than sustained drinking bouts — and as water intake falls below the 1.8:1 ratio, FCR climbs accordingly.
Flush lines with an approved line sanitizer between every batch. Run a hydrogen peroxide or chlorine dioxide treatment through the system at the end of each cycle, hold for the recommended contact time, and flush thoroughly before placement. Clean lines are not a biosecurity luxury — they are a direct FCR input.
Strategy 2 — Feeder Management and the Third-Full Rule
The Economics of Feed on the Floor
Feed that reaches the litter floor is a 100% financial loss. It will not be consumed in any meaningful quantity — birds will scratch through it, contaminate it with excreta, and wet it with drinker spillage until it is microbiologically unsafe and physically unpalatable. Unlike feed in the feeder, which represents potential conversion, feed on the floor represents only cost.
The primary mechanism by which feed reaches the floor in broiler houses is feeder overfilling. Birds are physically active eaters — they bill through feed material using a lateral sweeping motion of the beak to locate and select particles. When a feeder is filled beyond the point where feed is flush with or above the feeder lip, this billing action launches a continuous spray of feed particles over the edge and onto the litter. A feeder filled in a house of 10,000 birds loses a measurable percentage of its content to litter scatter before it is consumed. Across a 42-day cycle, this wastage accumulates to a significant proportion of total feed cost.
The Rule and Its Rationale
Never fill manual hanging feeders more than one-third full. At one-third capacity, the feed surface sits well below the feeder lip. The bird must reach slightly downward into the feeder to eat, which mechanically limits the billing scatter that occurs when the feed is flush with the rim. Consumption is more deliberate, wastage is reduced, and feed stays cleaner in the feeder for longer.
This rule requires more frequent feeder checks and refilling than the common practice of filling feeders to reduce labor frequency. The labor cost of more frequent refilling is recovered within the first cycle through reduced floor feed wastage. Calculate your current floor feed loss honestly by weighing what is incorporated into the litter at cleanout — the figure surprises most farmers who have never measured it directly.
Feeder Height — The Back-Level Standard
Feeder height is as important as fill level and is adjusted far less frequently than it should be. The correct height at every stage of production is the feeder lip level with the back of the bird when the bird is standing normally. At this height, the bird stands in a natural posture to eat, requires minimal physical effort to access feed, and the billing angle naturally directs feed downward into the beak rather than outward over the rim.
A feeder too low — a common error in the first two weeks when farmers set heights for day-old chicks and do not adjust — allows the bird to use a scooping motion that pulls significant feed volume over the edge with each mouthful. A feeder too high increases the effort required to eat, reduces feed intake relative to potential, and increases stress in the flock. Check and adjust feeder height at a minimum twice per week through the production cycle. In fast-growing Cobb 500 flocks, the correct height setting at Day 10 is measurably wrong by Day 17.
Strategy 3 — Temperature Management and Maintenance Energy
The Maintenance Energy Concept
Every calorie a broiler consumes is allocated to one of two purposes: maintenance energy or productive energy. Maintenance energy covers the metabolic cost of being alive — organ function, immune activity, thermoregulation, and basic cellular repair. Productive energy is what remains after maintenance demands are met and is available for muscle growth, fat deposition, and bone development. FCR worsens when the maintenance energy fraction increases, because a greater proportion of each kilogram of feed is consumed by overhead costs rather than generating saleable meat.
Temperature is the dominant driver of maintenance energy variation in broiler production. A bird in its thermoneutral zone — approximately 18–22°C for finisher-stage birds in weeks 4–6 — allocates minimal energy to thermoregulation. Every degree of ambient temperature below the thermoneutral zone forces the bird to increase metabolic heat production to maintain core body temperature. The quantified cost of this thermoregulatory overhead is approximately a 1–2% increase in feed consumption per degree Celsius below the comfort zone — feed consumed entirely for heat production, generating zero additional body weight.
The Management Implication
A finisher house running at 16°C instead of 20°C is imposing a 4°C temperature deficit on its flock. At 1.5% additional feed consumption per degree, that house is consuming 6% more feed than an equivalent house at 20°C, with no additional meat production to show for it. On a 10,000-bird flock consuming 2.8 kg feed per bird in weeks 4–6, 6% additional feed consumption represents 1,680 kg of feed per cycle spent entirely on keeping birds warm rather than growing them. At $0.50/kg feed, that is $840 per cycle burned by inadequate insulation.
The investment calculation is straightforward: the cost of improved curtain material, ceiling insulation, or sidewall repair that maintains house temperature at 20°C pays back in feed savings within one to three production cycles in most climates. Treating house temperature as a feed cost variable — which it is — changes the financial justification for infrastructure investment entirely. You are not spending money on building materials. You are buying feed efficiency.
Strategy 4 — Lighting Programs for Rest and Digest
The Continuous Light Myth
The assumption that 24 hours of light produces 24 hours of growth is one of the most persistent and costly myths in broiler management. It is intuitive — more time awake means more time eating, which means faster growth — and it is wrong.
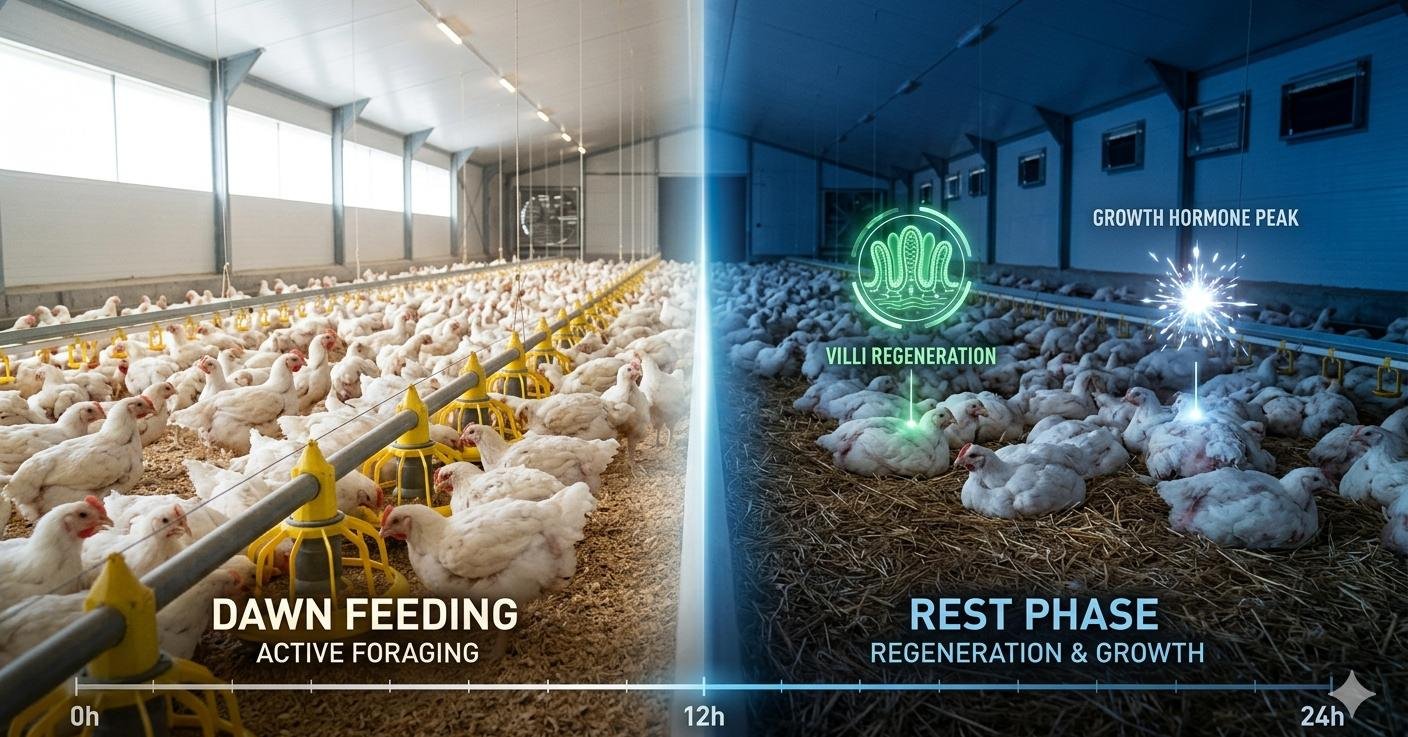
Continuous lighting produces several measurable negative outcomes that directly worsen FCR. Digestive efficiency is reduced because the gut does not undergo the accelerated motility and villi regeneration cycle that occurs during sleep-phase darkness. Leg health deteriorates because bone calcification and skeletal development are partially governed by growth hormone secretion, which peaks during dark periods. Flock uniformity declines because behaviorally subordinate birds — those displaced from feeders during light periods — use darkness as the primary opportunity to access feed without competition pressure.
The 4–6 Hour Darkness Protocol
Implementing 4–6 hours of continuous darkness per 24-hour period improves FCR through two distinct mechanisms. First, the dark period allows complete gut emptying and villi regeneration, so that when lights return and feeding resumes, absorption efficiency is higher than in a gut that has been continuously processing digesta. Second, the synchronized return of light triggers a simultaneous feeding response across the entire flock — a “dawn feeding” behavior where intake is high, competitive, and evenly distributed. Birds that have rested and fasted for a controlled period absorb nutrients more efficiently than birds in a continuous low-level feeding state.
Published lighting program research on Cobb 500 genetics consistently shows FCR improvements of 0.05–0.08 from implementing a 4-hour dark period compared to continuous light, with no statistically significant reduction in final body weight at Day 42 when the dark period is introduced after Day 5. The FCR saving alone — 0.05–0.08 FCR units across a 10,000-bird, 2.5 kg average weight flock — represents 125–200 kg of feed saved per cycle. The lighting programme costs nothing to implement.
Schedule the dark period during the lowest-activity hours — typically between midnight and 05:00 — to minimise disruption to voluntary feed intake during the productive daytime hours.
Strategy 5 — Feed Physical Form and the Pellet Factor
Why Physical Form Changes FCR
The physical form of feed — whether it is delivered as a pellet, crumble, or mash — affects FCR through two independent mechanisms: the energy cost of eating and the selective consumption problem.
Eating is not a metabolically neutral activity. A bird consuming 100g of mash must perform significantly more beak activity, head movement, and sorting behavior than a bird consuming 100g of uniform pellets or crumbles. The mash-fed bird expends measurable energy in the act of eating itself — energy that comes from the same feed pool and therefore does not contribute to growth. Well-controlled trials comparing pellet and mash diets of identical nutritional composition consistently show FCR improvements of 3–5% for pelleted or crumbled feed over mash, not because the nutrient content is higher, but because the physical act of consumption is more efficient.
The selective consumption problem compounds this. Mash feed is a heterogeneous mixture of particles of different sizes, densities, and palatability. Birds are capable of sorting mash selectively, consuming preferred fractions and leaving others. The consequence is that a bird fed mash rarely consumes the diet the nutritionist formulated — it consumes a skewed version of it, potentially deficient in specific amino acids or minerals that were carried in the less-palatable fine fraction. A pellet or uniform crumble eliminates selective consumption. Every beak-full delivers the complete nutrient profile.
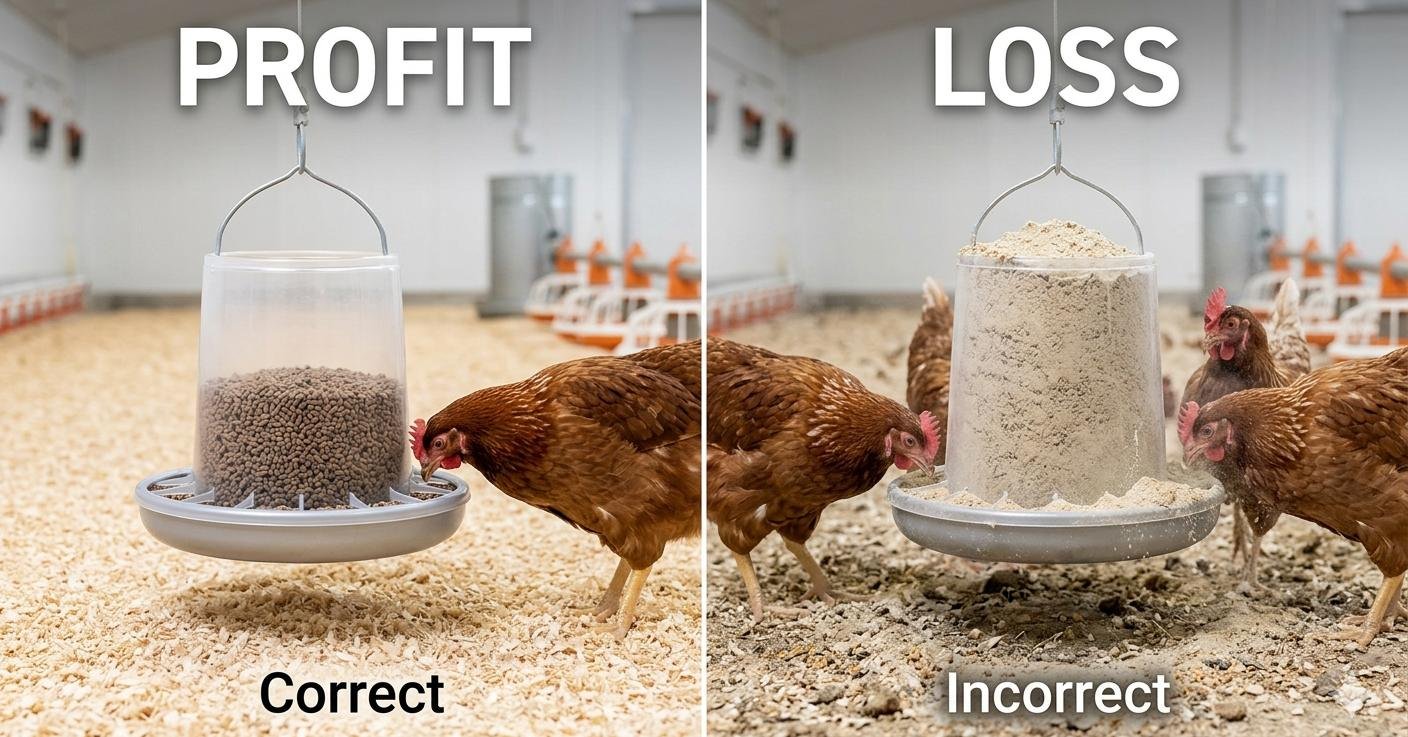
Managing Fines — The Overlooked FCR Leak
Even operations running pelleted or crumbled feed incur an FCR penalty if feed quality at the point of delivery is poor. Fines — the dust and broken particle fraction generated by mechanical handling, transport, and bag-filling — behave like mash at the bottom of every feeder. Birds consume the intact pellets and crumbles readily, then encounter a layer of fine dust that they reject, scratch through, and ultimately push over the feeder rim onto the litter.
Assess fines content in each feed delivery by sieving a representative 500g sample through a 1mm mesh. Acceptable fines content for broiler feed is below 10% by weight. Above 15%, FCR impact is measurable. If your regular deliveries exceed 10% fines, raise it with your feed miller formally — specifying acceptable fines tolerance in your feed supply agreement is standard practice in well-managed commercial operations and costs nothing to implement.
The FCR Profit Impact Matrix
| FCR Level | Classification | Feed per Bird (2.5kg target) | Feed Cost per Bird | Gross Margin Position | Action |
|---|---|---|---|---|---|
| 1.70 and above | Sub-standard — break-even risk | 4.25 kg | $2.13 | Marginal or loss-making at standard market prices | Immediate management audit required |
| 1.60 | Industry average | 4.00 kg | $2.00 | Moderate margin — vulnerable to feed price increases | Implement all five strategies |
| 1.55 | Good commercial performance | 3.88 kg | $1.94 | Healthy margin with pricing resilience | Maintain protocol, address remaining weak points |
| 1.50 | Strong performance | 3.75 kg | $1.88 | Competitive margin in all market conditions | Optimise lighting and feeder management |
| 1.45 | Otto’s Farms Elite Benchmark | 3.63 kg | $1.81 | Maximum margin — premium genetics fully expressed | Full protocol compliance, batch-by-batch tracking |
Feed cost calculated at $0.50/kg commercial finisher ration. Adjust for your local feed price.
The difference between a 1.70 FCR operation and a 1.45 FCR operation on a 10,000-bird farm is $320 per cycle in feed cost alone — $1,920 per year on a six-cycle programme — from the same house, the same genetics, and the same market price received. The entire five-strategy management programme described in this article costs nothing to implement beyond time and discipline. The margin improvement is immediate and compounds with every batch as protocols become standard operating procedure.
FCR Is the CEO’s Primary KPI
You are not in the business of raising chickens. You are in the business of converting grain into protein as efficiently as biology and management allow. Every kilogram of feed that passes through your house without generating a kilogram of saleable meat is a cost with no corresponding revenue.
The five strategies in this article — water ratio management, feeder discipline, temperature control, lighting programmes, and feed physical form — are not advanced techniques requiring specialist equipment or expensive consultants. They are management fundamentals that separate operations running 1.45 FCR from operations running 1.70 FCR, at identical feed quality and identical genetics. The difference is not what the birds eat. It is how precisely and consistently the farm is managed around the biology of conversion.
Track your FCR for every batch. Calculate it per house, not as a farm average — averages hide the variation that reveals management problems. Set a target, measure against it, and treat every deviation as information about which of the five strategies is underperforming. The farms consistently at elite FCR are not luckier or better-resourced than average farms. They are more disciplined about the fundamentals, every batch, without exception.