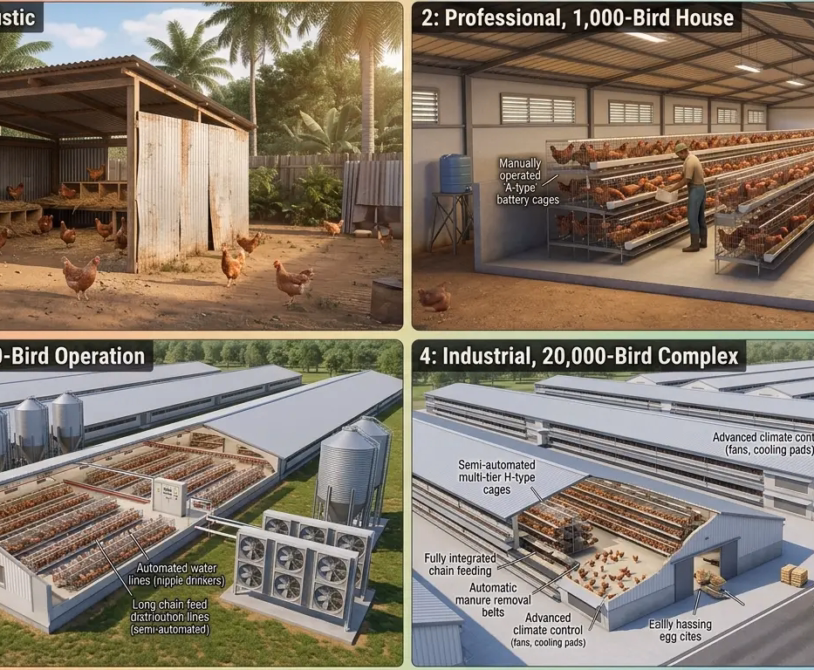
A 1,000-bird layer farm is the entry point to commercial egg production. It is large enough to generate meaningful monthly cash flow — at 90% laying rate, it produces approximately 810 eggs per day — and small enough that a first-time commercial farmer can manage it without a large management team or complex automation infrastructure.
It is also the scale at which most planning mistakes are made. The farmer who builds a 1,000-bird farm on an XAF 2 million budget discovers, three weeks into the first cycle, that she has spent XAF 1.8 million on housing and has XAF 200,000 remaining to feed 1,000 birds that will consume 115 kg of feed per day at a cost of approximately XAF 48,000 per day. The farm is built. The birds arrive. The feed money runs out in week 4.
This cost analysis is not a minimum viable cost exercise. It is a realistic full-cost model for a 1,000-bird layer farm in West and Central Africa — specifically calibrated to current 2026 input costs in Cameroon and Nigeria — that covers every expenditure category from land preparation to first egg revenue, with enough detail to identify where costs can be reduced without compromising bird performance and where cutting costs destroys the investment.
The Farm Model: What This Analysis Assumes
Before the numbers, the assumptions:
Production model: 1,000 commercial layer hens (Lohmann Brown Classic, ISA Brown, or Hy-Line Brown), battery cage or colony cage system, housed at approximately 450–500 cm² per bird in a purpose-built layer house.
Location: Peri-urban Cameroon or Nigeria — 30–60 km from a major city. Feed is purchased from a commercial mill. Day-old chicks are sourced from a registered hatchery.
Production targets: 90% peak laying rate, 65g average egg weight at peak lay, 300 eggs per hen over a 72-week laying cycle (420 days from placement to depopulation).
Cost currency: CFA franc (XAF) for Cameroon; Nigerian Naira (NGN) with XAF equivalents provided for cross-reference. Exchange reference: XAF 800 ≈ NGN 2,000 (approximate 2026 reference — verify current rates).
Feed cost reference: Commercial layer mash at XAF 330–360 per kg in Cameroon; NGN 800–900 per kg in Nigeria (2026 estimates based on input cost trajectory).
Section 1: Capital Expenditure (CAPEX) — One-Time Startup Costs
CAPEX is the money spent before the first bird arrives. It does not recur every cycle, but it must be recovered over the productive life of the farm through operating profit. Under-investing in CAPEX (building too cheaply) creates recurring operational costs that exceed what was saved. Over-investing in CAPEX creates a debt service burden that erodes margins for years.
1.1 Land
A 1,000-bird layer house requires approximately 80–100 m² of building footprint (at 5 birds per m² in cage systems with service aisles). The total land area required, including the farm perimeter, access road, feed storage, and biosecurity buffer, is 400–600 m².
In peri-urban Cameroon (Douala-Yaoundé axis), land leasing costs vary widely. Purchased land at 500 m² in a peri-urban agricultural zone: XAF 3–8 million. Land lease (3–5 year term, annual payment): XAF 150,000–400,000 per year.
For this model, we assume land is leased rather than purchased — the lowest barrier to entry.
Land lease (first year, advance): XAF 200,000–350,000
1.2 Poultry House Construction
The layer house is the largest single CAPEX item and the one with the most cost variation depending on material choices.
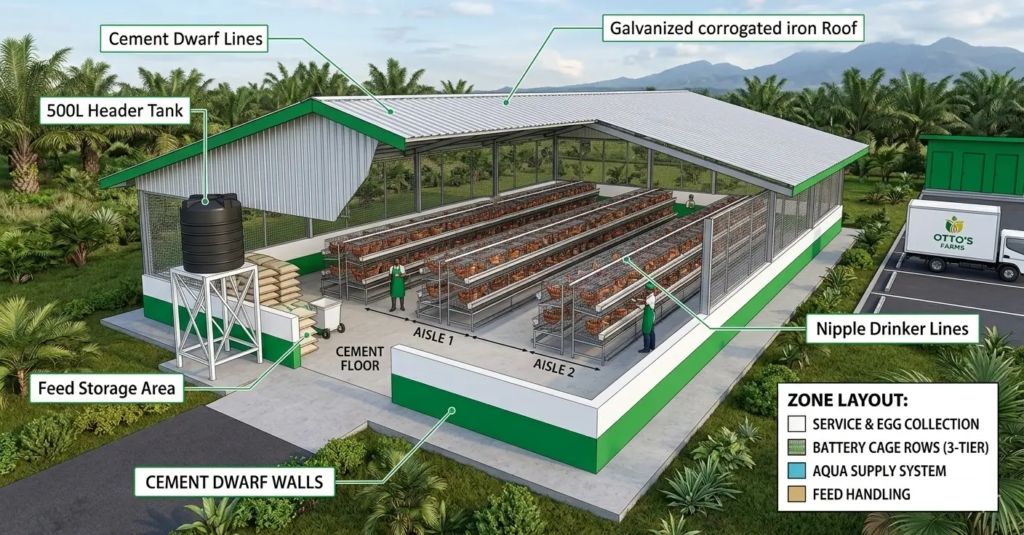
Minimum viable layer house (open-sided, galvanized iron roof, cement block walls to 1.0m dwarf wall, wire mesh upper walls, concrete floor):
| Component | Specification | Estimated Cost (XAF) |
|---|---|---|
| Foundation and floor slab | 10m × 9m concrete floor, 10cm thickness | 800,000–1,200,000 |
| Wall construction | Cement block to 1m, wire mesh above | 600,000–900,000 |
| Roof structure | Steel/timber trusses, galvanized iron roofing | 900,000–1,400,000 |
| Ridge vent / ventilation | Open ridge construction, adjustable side vents | 150,000–250,000 |
| Doors and entry systems | Two entry doors, footbath installation | 100,000–180,000 |
| Electrical installation | Lighting circuit, timer installation, wiring | 200,000–350,000 |
| Painting and finishing | Whitewash interior, weather-sealant exterior | 80,000–120,000 |
| Total construction estimate | XAF 2,830,000–4,400,000 |
A well-built open-sided layer house for 1,000 birds should cost approximately XAF 3.0–4.5 million in materials and labor in 2026 at Cameroon prices. Nigerian construction costs in Northern states are somewhat lower; Lagos/South-West states are comparable or higher.
Do not build below the minimum specification. A house with a leaking roof, inadequate ventilation, and a dirt floor will cost more in production losses per cycle than the savings on construction.
1.3 Cage Equipment
Battery cages for 1,000 birds at 5 birds per cage require 200 cage units in a 3- or 4-tier configuration.
Standard 3-tier battery cage (5 birds per cell, 3 cells per unit = 15 birds per unit):
- Number of units for 1,000 birds: 67 units
- Cost per unit (imported or locally fabricated, galvanized): XAF 35,000–65,000 per unit
- Total cage cost: XAF 2,345,000–4,355,000
4-tier cage (more birds per linear meter, higher capital per unit):
- Total cage cost for equivalent capacity: XAF 2,800,000–5,200,000
Installation and adjustment: XAF 150,000–250,000 (labor to assemble and align cage rows, connect feeders and drinkers)
Total cage equipment: XAF 2,500,000–4,600,000
Locally fabricated cages are significantly cheaper than imported ones but vary in quality — verify weld quality, wire gauge (minimum 2.0mm for cage floors, 2.5mm for cage frames), and galvanization coverage before purchasing. Poorly welded cages fail within 2–3 production cycles and require costly replacement.
1.4 Feeding and Watering Systems
Manual chain feeder system (basic):
- Feed trough and chain for 1,000-bird house: XAF 180,000–300,000
Nipple drinker system with header tank:
- Nipple drinker lines (1 nipple per 12 birds = 84 nipples): XAF 150,000–280,000
- Header tank (500L, elevated position): XAF 45,000–80,000
- PVC distribution piping, fittings, pressure regulator: XAF 60,000–110,000
- Total water system: XAF 255,000–470,000
Total feeding and watering: XAF 435,000–770,000
1.5 Lighting System
LED lighting installation (target 25 lux at bird level, warm white 2700K LEDs, digital programmable timer with battery backup):
- 10–15 LED agricultural-grade bulbs at XAF 8,000–15,000 each: XAF 80,000–225,000
- Wiring, fittings, and reflectors: XAF 40,000–80,000
- Digital timer with battery backup: XAF 25,000–60,000
- Total lighting: XAF 145,000–365,000
1.6 Brooding Equipment (First Cycle Only)
Chicks must be brooded before moving to the layer house. Either brood in a separate brooder house or in a cordoned brooding zone within the layer house.
- Gas or electric brooder (capacity for 1,000 chicks): XAF 80,000–180,000
- Chick guards, paper tray materials, thermometer/hygrometer: XAF 25,000–55,000
- Total brooding equipment: XAF 105,000–235,000
1.7 Ancillary Infrastructure
- Feed storage bin or room (minimum 2-tonne capacity): XAF 80,000–200,000
- Dead bird disposal facility (composting bin or incineration): XAF 30,000–80,000
- Footbath installation and disinfectant supply (3-month supply): XAF 20,000–45,000
- Basic farm tools (litter fork, broom, shovel, wheelbarrow): XAF 30,000–60,000
- Water storage tank (1,000L overhead or ground-level): XAF 45,000–90,000
- Total ancillary: XAF 205,000–475,000
CAPEX Summary
| Category | Low Estimate (XAF) | High Estimate (XAF) |
|---|---|---|
| Land lease (first year) | 200,000 | 350,000 |
| House construction | 2,830,000 | 4,400,000 |
| Cage equipment | 2,500,000 | 4,600,000 |
| Feeding and watering systems | 435,000 | 770,000 |
| Lighting system | 145,000 | 365,000 |
| Brooding equipment | 105,000 | 235,000 |
| Ancillary infrastructure | 205,000 | 475,000 |
| Total CAPEX | 6,420,000 | 11,195,000 |
Realistic CAPEX estimate for a well-built 1,000-bird layer farm in 2026: XAF 7.5–9.5 million.
The low-end estimate assumes owner-managed construction with locally sourced materials and fabricated cages. The high-end estimate assumes contracted construction with imported cages and complete system installations.
Section 2: Variable Operating Costs (OPEX) — Per Production Cycle
OPEX is the money spent every cycle to keep the farm producing. Unlike CAPEX, it recurs. It determines whether the farm is profitable on a cycle-by-cycle basis.
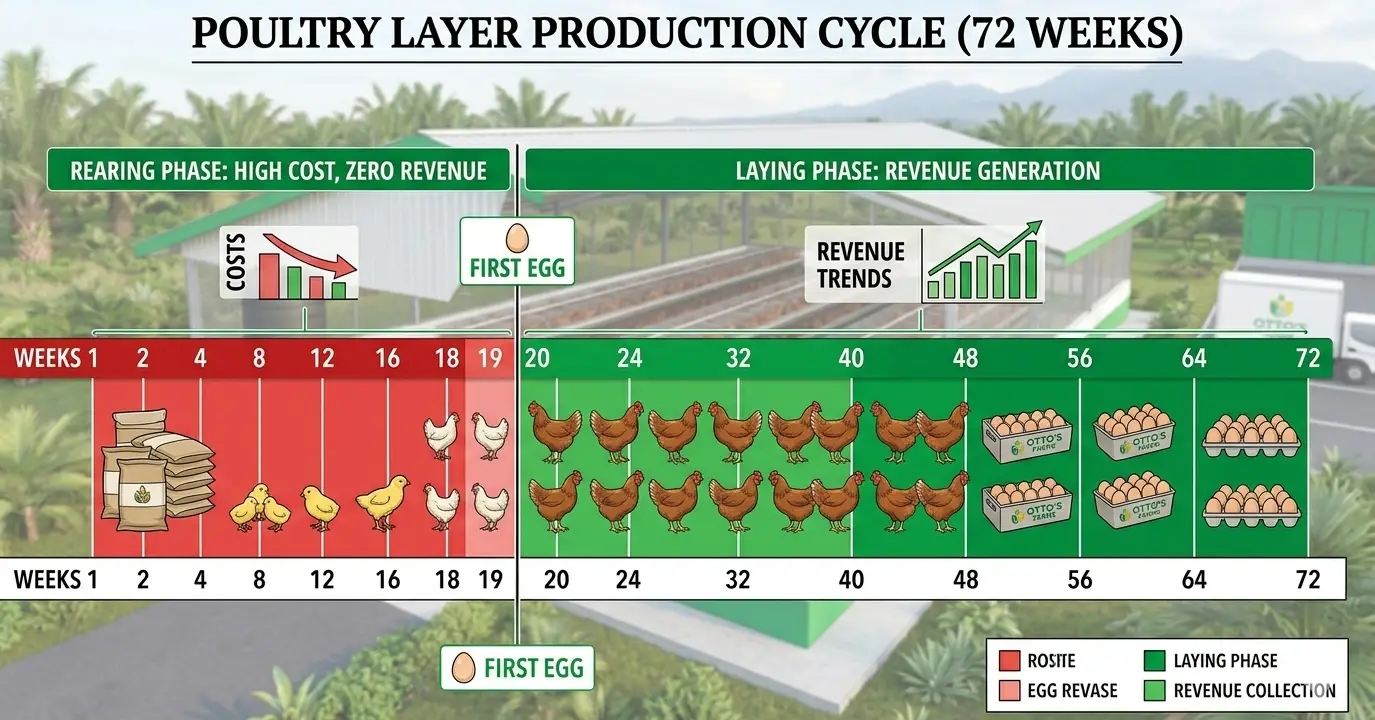
A 1,000-bird layer production cycle runs from day-old chick placement to depopulation at approximately 72–80 weeks of age (420–500 days). We model a 72-week (504-day) cycle from chick arrival to depopulation.
2.1 Day-Old Chicks
- 1,000 day-old chicks from a registered hatchery (commercial brown-egg layer breed): XAF 1,100–1,500 per chick
- Allow 5% rearing mortality buffer (purchase 1,050 chicks for 1,000 laying positions): 1,050 chicks × XAF 1,200 average = XAF 1,260,000
Chick quality varies significantly between hatcheries. Do not source from a hatchery that does not provide a vaccination record, hatch date, and parent flock health certificate. The cost difference between a good hatchery and a poor one is XAF 100–200 per chick. The production difference — in first-cycle uniformity, early mortality, and Marek’s vaccine efficacy — is worth far more than that difference.
2.2 Feed Costs
Feed is the single largest operating cost — typically 65–72% of total variable costs in layer production.
Rearing feed (0–17 weeks):
- Starter crumble (weeks 1–6): 0–6 weeks at approximately 30g/day/bird average = 1,000 birds × 30g × 42 days = 1,260 kg
- Grower/developer (weeks 7–17): 7–17 weeks at approximately 65g/day/bird average = 1,000 birds × 65g × 77 days = 5,005 kg
- Total rearing feed: approximately 6,265 kg
- Average rearing feed cost: XAF 300/kg
- Rearing feed cost: XAF 1,879,500
Layer feed (weeks 18–72):
- Peak and mid-lay feed (weeks 18–52): 1,000 birds × 115g/day × 245 days = 28,175 kg
- Late-lay feed (weeks 52–72): 950 birds (allowing 5% total laying mortality) × 120g/day × 140 days = 15,960 kg
- Total layer feed: approximately 44,135 kg
- Average layer feed cost: XAF 345/kg (blend of peak and late-lay ration costs)
- Layer feed cost: XAF 15,226,575
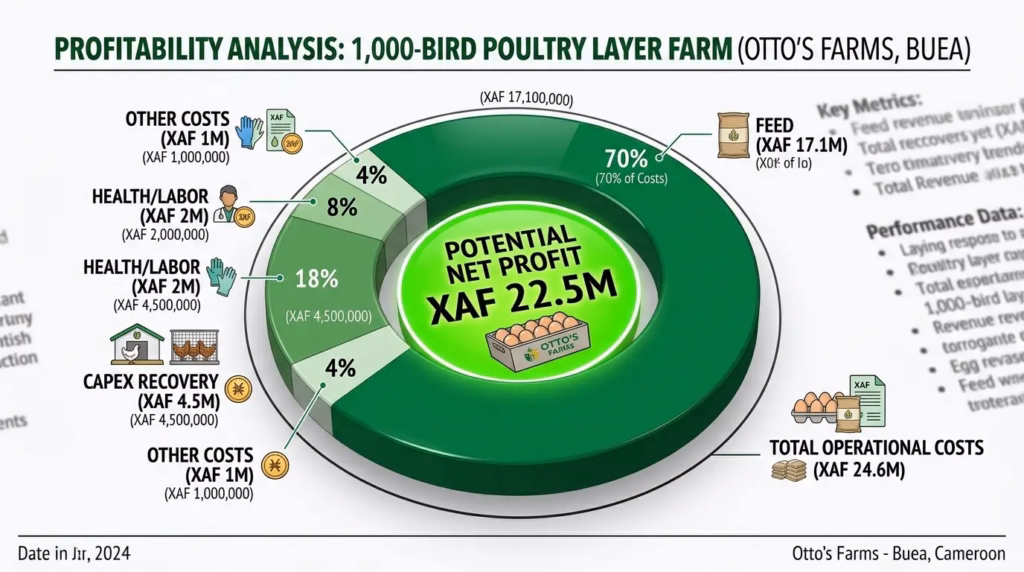
Total feed cost (full cycle): XAF 17,106,075
This is the number that determines farm viability. Every formulation choice, FCR improvement, feed wastage reduction, and heat stress management decision directly affects this figure. An FCR improvement of 0.10 across the laying period saves approximately XAF 450,000 in feed cost at these prices.
2.3 Health Inputs
Vaccines (full rearing and first-year lay vaccination program):
- Marek’s disease (day 1, hatchery): included in chick cost at most hatcheries
- Newcastle disease (5 doses across rearing + 4-weekly revaccination during lay): XAF 85,000–130,000 per cycle
- Gumboro IBD (2 doses rearing): XAF 25,000–45,000
- Infectious Bronchitis (1–2 doses): XAF 20,000–35,000
- Fowl Pox (1 dose): XAF 18,000–28,000
- Infectious Coryza bacterin (2-dose primary + annual booster): XAF 45,000–80,000
- Pre-transfer killed ND + IB + EDS multivalent: XAF 30,000–55,000
- Total vaccines: XAF 223,000–373,000
Antiparasitic treatments:
- Fenbendazole treatment (2 strategic deworming events per cycle): XAF 35,000–65,000
- Acaricide for mite treatment (2 treatments): XAF 25,000–50,000
- Coccidiostat in starter/grower feed (included in feed cost above if pre-mixed)
- Total antiparasitic: XAF 60,000–115,000
Antibiotics and treatment medications (annual average, well-managed flock):
- Allow 2–3 treatment events per cycle at XAF 40,000–90,000 per event
- Treatment medications: XAF 80,000–270,000
Vitamins, electrolytes, organic acid supplements:
- Vitamin/electrolyte supplementation during brooding, heat stress periods, vaccination events: XAF 60,000–120,000
- Organic acid program (multi-acid blend in feed): XAF 120,000–220,000
- Total supplements: XAF 180,000–340,000
Total health inputs: XAF 543,000–1,098,000 Realistic estimate: XAF 700,000–850,000 per cycle
2.4 Labor
For a 1,000-bird operation, the labor requirement is 1 full-time farm worker plus part-time family labor or owner-managed time.
- 1 full-time farmhand: XAF 45,000–75,000 per month
- Annual labor cost: XAF 540,000–900,000
- Over a 72-week cycle (17 months equivalent): XAF 765,000–1,275,000
If the owner actively manages the farm, some of this cost is absorbed by sweat equity — but it must be recognized as a real cost when evaluating farm profitability and comparing against other employment options.
2.5 Utilities
- Electricity (lighting, fans if installed, water pump): XAF 15,000–35,000 per month → XAF 255,000–595,000 per cycle (17 months)
- Water (borehole, well, or municipal supply): XAF 5,000–20,000 per month → XAF 85,000–340,000 per cycle
- Generator fuel (for backup power, 2–4 hours per week on average): XAF 10,000–25,000 per month → XAF 170,000–425,000 per cycle
- Total utilities: XAF 510,000–1,360,000
2.6 Consumables and Miscellaneous
- Litter material (brooding phase): XAF 30,000–60,000
- Disinfectants and biosecurity supplies: XAF 60,000–120,000 per cycle
- Egg collection trays and packaging: XAF 80,000–150,000 per cycle (at XAF 500–800 per 30-egg tray, assuming 1 tray per 3 uses)
- Miscellaneous repairs and maintenance: XAF 80,000–180,000 per cycle
- Total consumables: XAF 250,000–510,000
OPEX Summary (Per 72-Week Production Cycle)
| Category | Low Estimate (XAF) | High Estimate (XAF) |
|---|---|---|
| Day-old chicks | 1,155,000 | 1,575,000 |
| Feed (rearing + laying) | 15,200,000 | 19,500,000 |
| Health inputs | 543,000 | 1,098,000 |
| Labor | 765,000 | 1,275,000 |
| Utilities | 510,000 | 1,360,000 |
| Consumables | 250,000 | 510,000 |
| Total OPEX (per cycle) | 18,423,000 | 25,318,000 |
Realistic total OPEX estimate: XAF 20–22 million per 72-week cycle.
Feed is 73–78% of total OPEX. This is the single largest controllable cost variable — every management decision that improves FCR, reduces feed wastage, and maintains production through heat stress and disease events directly reduces this figure.
Section 3: Revenue Projection
Egg Production
Production model:
- 1,000 hens housed
- Rearing mortality: 5% → 950 hens reach the point of lay
- Laying mortality (over 72 weeks): 5% → approximately 903 hen-average over cycle
- Average laying rate across full cycle: 80% (accounting for production ramp-up, peak, and late-lay decline)
- Average eggs per day: 903 × 80% = 722 eggs/day
- Total eggs over 72-week cycle (504 days): 722 × 504 = 363,888 eggs
- Expected cracked/unsaleable rate: 3% → Saleable eggs: 353,000
Egg Revenue
Price assumptions (Douala/Yaoundé/Lagos peri-urban markets, 2026):
- Standard commercial brown egg, 55–65g: XAF 120–160 per egg (retail/wholesale blend)
- Premium market (hotel supply, supermarket, 65g+): XAF 160–220 per egg
| Scenario | Price per Egg | Total Revenue |
|---|---|---|
| Standard wholesale only | XAF 120 | XAF 42,360,000 |
| Mixed wholesale + retail | XAF 140 | XAF 49,420,000 |
| Premium channel + retail blend | XAF 160 | XAF 56,480,000 |
Realistic egg revenue: XAF 42–52 million per cycle (depending on market channel access and egg grade distribution)
Spent Hen Revenue
At the end of the cycle, spent hens (approximately 900 birds after 72-week mortality) are sold as live birds or slaughtered and sold at market.
- Spent hen sale price: XAF 1,500–2,800 per bird live weight
- 900 birds × XAF 2,000 average: XAF 1,800,000
Total Cycle Revenue: XAF 44–54 million
Section 4: Profitability Analysis
Gross Profit per Cycle
Revenue: XAF 44–54 million OPEX: XAF 20–22 million Gross Profit (before CAPEX recovery): XAF 22–32 million
CAPEX Recovery
CAPEX of XAF 7.5–9.5 million must be recovered over the productive life of the farm infrastructure. Assuming:
- House structure: 10-year useful life = 3 cycles (at 72 weeks per cycle)
- Cage equipment: 5-year useful life = 2–2.5 cycles
- Equipment (lighting, water, feeders): 5–7 years of useful life
CAPEX allocation per cycle (straight-line depreciation):
- House: XAF 7.5M–9.5M ÷ 3 cycles = XAF 2.5–3.2 million per cycle
- Cage: XAF 2.5M–4.6M ÷ 2.5 cycles = XAF 1.0–1.8 million per cycle
- Equipment: XAF 1.0M–1.5M ÷ 3 cycles = XAF 0.33–0.5 million per cycle
- Total CAPEX per cycle: XAF 3.8–5.5 million
Net Profit per Cycle (After CAPEX Recovery)
| Scenario | Revenue (XAF) | OPEX (XAF) | CAPEX/Cycle (XAF) | Net Profit (XAF) |
|---|---|---|---|---|
| Conservative | 44,000,000 | 22,000,000 | 5,500,000 | 16,500,000 |
| Base case | 48,000,000 | 21,000,000 | 4,500,000 | 22,500,000 |
| Optimistic | 54,000,000 | 20,000,000 | 3,800,000 | 30,200,000 |
Monthly net profit equivalent (over 17-month cycle):
- Conservative: XAF 970,000/month
- Base case: XAF 1,320,000/month
- Optimistic: XAF 1,780,000/month
Working Capital Requirement
CAPEX is spent before the farm earns revenue. OPEX costs begin accruing at day 1 of the chick placement, and revenue does not begin until week 18 at the earliest, with meaningful cash flow not starting until week 20–22.
Working capital needed before first egg revenue:
- Chick cost: XAF 1,260,000
- 18 weeks of rearing feed: approximately XAF 1,880,000
- 18 weeks of rearing health inputs, labor, utilities: approximately XAF 1,200,000
- Pre-revenue working capital: approximately XAF 4,340,000
This means a farm with XAF 9 million in total startup capital (CAPEX 7.5M + working capital) needs approximately XAF 11.5–13 million in accessible capital to reach its first egg without a cash flow crisis. A farm started with less than XAF 10 million total will likely face a feed payment crisis in the rearing period.
Section 5: Key Risks and Cost Reduction Strategies
Top 5 Cost Risks
1. Feed price inflation: Feed costs rose 25–40% across West Africa between 2022 and 2025 due to import cost increases for soybean meal and amino acids. Budget with a 10–15% feed price escalation scenario for year 2 of the operation.
2. Newcastle disease outbreak in the first cycle: A single velogenic NDV outbreak in an inadequately vaccinated flock can produce 40–80% mortality before it is contained. At XAF 1,200 per replacement bird plus 6–8 weeks of empty house time, a single uncontrolled outbreak can eliminate an entire cycle’s profit.
3. Poor chick quality: Day-old chicks from a hatchery with poor Marek’s vaccine handling, high in-ovo bacterial contamination, or inconsistent parent flock vaccination produce higher rearing mortality and lower laying performance regardless of how well the farm is managed. Source quality matters.
4. Market access failure: 360,000 eggs per cycle from a single farm cannot all be sold to one buyer. Build at least three market channels before purchasing chicks: a regular wholesale buyer, a retail market relationship, and a direct customer base (households, restaurants). Market access failure is the most common cause of cash flow crisis in first-cycle layer operations.
5. Inadequate working capital: As calculated above, the rearing period consumes capital without generating revenue. Farms that run out of feed money in week 10 because all capital was spent on construction are the most common failure scenario at this scale.
Practical Cost Reduction Without Performance Sacrifice
- On-farm feed mixing (where reliable ingredient sourcing exists): reduces feed cost by 15–25% vs. complete commercial ration purchase — but requires accurate formulation, ingredient quality testing, and mixer capital cost
- Pigmentation supplementation in local ingredients (red palm oil + moringa): reduces yolk color supplement cost by 40–60% vs. imported marigold meal alone while improving natural ingredient narrative for premium markets
- Solar power for lighting circuit: eliminates generator fuel cost for lighting at a payback of approximately 18–24 months on a 2kW system
- Owner-managed labor: reduces labor OPEX by XAF 540,000–900,000 per cycle — but this is only viable if the owner has agricultural management skills and time commitment for daily farm supervision
Summary
A 1,000-bird layer farm started in 2026 in West or Central Africa requires:
- XAF 7.5–9.5 million in capital expenditure for infrastructure and equipment
- XAF 4.0–4.5 million in working capital before first egg revenue
- Total startup capital: XAF 11.5–14 million
It generates:
- XAF 44–54 million in gross revenue per 72-week cycle
- XAF 16.5–30 million in net profit after OPEX and CAPEX recovery
- XAF 970,000–1,780,000 per month equivalent cash return
The business is profitable at this scale when managed correctly. Feed efficiency, disease prevention, market access, and working capital management are the four variables that determine whether the operation achieves the base case or falls to the conservative scenario.
The 1,000-bird farm is not a hobby. It is a small business with monthly cash flow requirements, supplier relationships, health management obligations, and market commitments. Treated as a business from day one — with a proper budget, a health calendar, a market access plan, and adequate working capital — it is one of the most viable agricultural enterprises available to first-generation commercial farmers in the region.
Treated as an afterthought, funded from savings with no formal plan, it is one of the most reliable ways to lose XAF 5–8 million in 18 months.
The difference is planning. This analysis is the starting point for that plan.
Download the analysis in PDF here is the link: Ottos_Farms_1000_Bird_Layer_Analysis_2026-1.pdf