Revenue is not profit. This is the most important financial distinction in layer farming — and the one most consistently ignored when a farmer looks at XAF 42 million in egg sales from a 1,000-bird flock and concludes the farm is doing well.
The XAF 42 million in revenue cost XAF 21 million in feed, XAF 800,000 in health inputs, XAF 900,000 in labor, XAF 600,000 in utilities, XAF 400,000 in consumables, and XAF 4.5 million in CAPEX recovery. That is XAF 28.2 million in costs against XAF 42 million in revenue — a net profit of XAF 13.8 million over a 17-month production cycle, or approximately XAF 812,000 per month. The farm is profitable. But the profitability is not XAF 42 million. It is XAF 13.8 million. And understanding the distance between those two numbers — and the specific costs that create that distance — is what financial management in layer farming requires.
Return on investment (ROI) and break-even analysis are the two tools that answer the questions every layer farmer should be asking before the first chick arrives: How much money does this farm need to make to justify the capital invested? How many eggs per day does the farm need to sell, at what price, to cover its costs? And if production or price drops — because of disease, heat stress, or market disruption — at what point does the farm stop covering its costs and start losing money?
This article builds both calculations from first principles, with numbers calibrated to West and Central African layer production economics in 2026.
Part 1: Return on Investment (ROI)
What ROI Measures
Return on investment measures how much profit the farm generates relative to the capital invested. It answers the question: “For every franc I put into this farm, how many francs do I get back?”
The basic ROI formula:
ROI (%) = (Net Profit ÷ Total Investment) × 100
Where:
- Net Profit = Total Revenue − Total Costs (OPEX + CAPEX recovery)
- Total Investment = Total capital deployed in the farm (CAPEX + initial working capital)
ROI is expressed as a percentage and is most useful when compared against:
- The return available from alternative investments (bank savings rates in Cameroon: 3–5% per year; government treasury bills: 5–8%)
- The return from other agricultural enterprises
- Industry benchmarks for commercial layer operations
A well-managed 1,000-bird layer farm should generate an annualized ROI of 35–60% on total investment. If your calculation produces a figure below 20%, either your costs are too high, your production performance is below potential, or your market price is too low.
Calculating ROI for a 1,000-Bird Layer Farm
Using the base case figures from the cost analysis:
| Item | Amount (XAF) |
|---|---|
| Total CAPEX (infrastructure + equipment) | 8,500,000 |
| Initial working capital (pre-revenue period) | 4,340,000 |
| Total Investment | 12,840,000 |
| Item | Amount (XAF) |
|---|---|
| Total egg revenue (72-week cycle) | 48,000,000 |
| Spent hen revenue | 1,800,000 |
| Total Revenue | 49,800,000 |
| Item | Amount (XAF) |
|---|---|
| Total OPEX (feed, health, labor, utilities, consumables) | 21,000,000 |
| CAPEX recovered in cycle (depreciation allocation) | 4,500,000 |
| Total Costs | 25,500,000 |
Net Profit = XAF 49,800,000 − XAF 25,500,000 = XAF 24,300,000
ROI = (XAF 24,300,000 ÷ XAF 12,840,000) × 100 = 189%
This is a per-cycle ROI over 17 months (72 weeks + 6-week cleanout period). To convert to annualized ROI:
Annualized ROI = Cycle ROI × (12 ÷ Cycle Duration in Months) Annualized ROI = 189% × (12 ÷ 18) = 126% per year
This figure looks exceptional compared to financial market returns. It is, but it comes with the labor, risk, and management intensity of running a commercial livestock operation. The correct comparison is not against a passive savings account but against other active agricultural or business investments at the same risk level.
ROI Sensitivity Analysis: How Performance Changes the Number
The ROI calculation above assumes base case performance. In practice, performance varies — and ROI is extremely sensitive to changes in the key input variables.
Impact of key variable changes on net profit and ROI:
| Scenario Change | Net Profit Impact (XAF) | ROI Impact |
|---|---|---|
| Laying rate drops from 80% to 70% average | −5,040,000 | −39 percentage points |
| Feed cost increases 15% (price inflation) | −3,150,000 | −25 percentage points |
| Egg price drops from XAF 140 to XAF 120 | −7,060,000 | −55 percentage points |
| FCR improves by 0.10 (saves ~450kg feed) | +155,250 | +1.2 percentage points |
| Disease outbreak causes 15% mortality | −3,600,000 (lost production) −1,890,000 (replacement cost) | −43 percentage points |
| Market channel improves: XAF 140 → XAF 160 | +7,060,000 | +55 percentage points |
The sensitivity table reveals two critical insights:
1. Egg price is the single largest ROI driver. A XAF 20-per-egg price improvement is worth more to net profit than a 10% improvement in laying rate, a disease-free cycle, and FCR optimization combined. This is why market access — not just production optimization — determines farm profitability at 1,000-bird scale.
2. Disease and market price are the two uncontrolled risk variables. Feed price inflation, management-driven FCR improvement, and production optimization are all within management control. An NDV outbreak or a market price collapse is an external event. Managing these risks requires a vaccination program (to protect against disease) and market diversification (to protect against price dependence on a single buyer).
Part 2: Break-Even Analysis
What Break-Even Measures
Break-even analysis answers a different question from ROI. ROI asks: “How much do I make on this investment?” Break-even asks: “What is the minimum performance level at which this farm stops losing money?”
There are three break-even calculations that every layer farmer should know:
- Cost break-even price per egg — the minimum price per egg at which the farm covers all its costs
- Production break-even — the minimum number of eggs per day the farm must sell to cover daily costs
- Occupancy break-even — the minimum laying rate the farm must achieve to avoid a loss
Each calculation answers a different risk management question.
Break-Even Price Per Egg
Formula:
Break-Even Price = Total Costs per Cycle ÷ Total Saleable Eggs per Cycle
Using base case figures:
- Total costs per cycle: XAF 25,500,000
- Total saleable eggs: 353,000 (from the production model in the cost analysis)
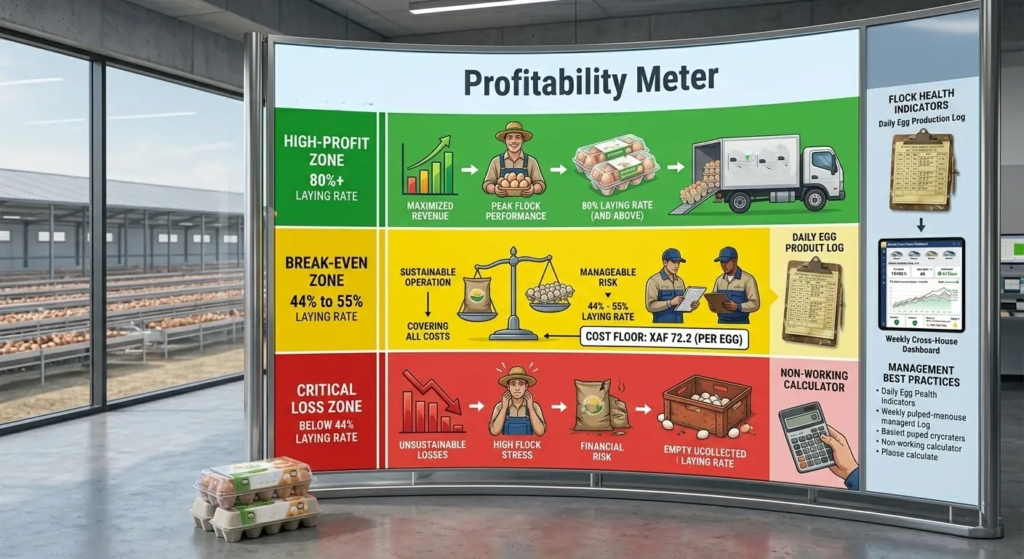
Break-Even Price = XAF 25,500,000 ÷ 353,000 = XAF 72.2 per egg
This means that at the base case production volume and cost structure, the farm needs to receive at least XAF 72.2 per egg to cover all costs, including CAPEX recovery. Below this price, every egg sold loses money.
The current market price of XAF 120–160 per egg means the farm has a price margin of XAF 48–88 above break-even. That margin is the buffer between profitability and loss when market prices drop.
Break-even price sensitivity to production volume:
| Saleable Eggs Produced | Break-Even Price per Egg | Margin at XAF 140 Market Price |
|---|---|---|
| 353,000 (base case, 80% lay rate) | XAF 72.2 | XAF 67.8 per egg |
| 318,000 (72% lay rate, -10%) | XAF 80.2 | XAF 59.8 per egg |
| 283,000 (64% lay rate, -20%) | XAF 90.1 | XAF 49.9 per egg |
| 247,000 (56% lay rate, -30%) | XAF 103.2 | XAF 36.8 per egg |
| 212,000 (48% lay rate, -40%) | XAF 120.3 | XAF 19.7 per egg |
At 48% average laying rate — a level reachable in a poorly managed flock with disease events or inadequate nutrition — the break-even price rises to XAF 120.3 per egg. At the XAF 120 wholesale price, the farm is barely breaking even. At XAF 110 (which is within the range of seasonal wholesale price compression in some markets), it is losing money.
This calculation shows that a 30–40% production underperformance does not merely reduce profit — it threatens the viability of the entire operation at current market prices.
Production Break-Even (Daily Egg Sales Required)
Formula:
Daily Break-Even Eggs = Total Daily Costs ÷ Selling Price per Egg
Total daily costs = Total OPEX per cycle ÷ Days in cycle = XAF 21,000,000 ÷ 504 days = XAF 41,667 per day in OPEX
Including CAPEX recovery: = XAF 25,500,000 ÷ 504 days = XAF 50,595 per day in total costs
At XAF 140 per egg selling price: Daily Break-Even Eggs = XAF 50,595 ÷ XAF 140 = 361 eggs per day
This means the farm must sell at least 361 eggs per day to cover all costs at XAF 140 per egg. At 1,000 hens, this requires a laying rate of: 361 ÷ 950 laying hens × 100 = 38% laying rate
This seems comfortable — a 38% laying rate is well below the 80% target. However, consider:
- The break-even calculation above uses the average total cost per day, not the peak cost. During the rearing period (18 weeks), costs run at approximately XAF 15,000–20,000 per day in feed and inputs with zero egg revenue. This is where the working capital is consumed.
- The break-even calculation does not account for the timing of costs and revenues. Feed must be paid for weekly or biweekly. Eggs are sold daily or weekly. The cash flow cycle — when money goes out vs. when it comes in — determines whether a farm with adequate annual profitability runs into cash flow crises mid-cycle.
Occupancy Break-Even (Laying Rate Required)
Formula:
Break-Even Laying Rate = Daily Break-Even Eggs ÷ Laying Hens on Farm × 100
At XAF 120 per egg (lower wholesale price):
- Daily Break-Even Eggs = XAF 50,595 ÷ XAF 120 = 422 eggs per day
- Break-Even Laying Rate = 422 ÷ 950 × 100 = 44.4%
At XAF 160 per egg (premium pricing):
- Daily Break-Even Eggs = XAF 50,595 ÷ XAF 160 = 317 eggs per day
- Break-Even Laying Rate = 317 ÷ 950 × 100 = 33.4%
Occupancy break-even summary by market price:
| Egg Price (XAF) | Daily Break-Even Eggs | Required Laying Rate | Safety Margin vs. 80% Target |
|---|---|---|---|
| 110 | 460 | 48.4% | 31.6 percentage points |
| 120 | 422 | 44.4% | 35.6 percentage points |
| 130 | 389 | 41.0% | 39.0 percentage points |
| 140 | 361 | 38.0% | 42.0 percentage points |
| 160 | 317 | 33.4% | 46.6 percentage points |
The safety margin — the gap between the required break-even laying rate and the target 80% laying rate — increases with egg price. This is why premium market access is not just a revenue optimization strategy; it is a risk management strategy. A farm selling at XAF 160 per egg has 46.6 percentage points of production safety margin before the farm stops covering its costs. A farm selling at XAF 110 per egg has only 31.6 percentage points — meaning a disease event that reduces laying rate by 35% pushes the farm into loss territory.
Part 3: Cash Flow Analysis — The Cycle That Determines Survival
ROI and break-even calculations show the annual or cycle-level economic picture. Cash flow analysis shows whether the farm survives month-to-month. A farm can be profitable over a 17-month cycle and still fail in month 6 if it cannot meet its feed payment obligations.
The Layer Farm Cash Flow Timeline
Months 1–5 (Rearing Period — Pure Cash Outflow):
- Week 1: Chick purchase (XAF 1,260,000), brooding setup, initial feed purchase
- Weeks 1–18: Feed purchases (approximately XAF 110,000 per week), labor (XAF 44,000 per week), utilities (XAF 30,000 per week), vaccine and health inputs (XAF 25,000 per week average)
- Total cash outflow during rearing: approximately XAF 3,900,000–4,500,000
- Revenue during rearing: zero
Month 5 (Week 18–22 — First Egg to 50% Production):
- First eggs appear at week 18–19
- Revenue ramps up from approximately XAF 50,000/day at 10% lay to XAF 400,000/day at 50% lay
- Costs remain at approximately XAF 50,000–55,000/day (feed now at full laying ration)
- This period is cash flow neutral to slightly positive — barely covering daily costs
Months 6–16 (Peak and Mid-Lay — Positive Cash Flow):
- Revenue: approximately XAF 90,000–110,000 per day at 80–90% lay rate at XAF 130–150 average price
- Daily costs: approximately XAF 50,000–55,000
- Daily net cash flow: XAF 40,000–60,000
- This is the period during which the rearing period investment is recovered
Month 17–18 (Late Lay and Depopulation):
- Laying rate declining to 65–70%
- Revenue declining toward the break-even level
- Depopulation: spent hen sales (approximately XAF 1,800,000 in a lump sum)
- Cleanout costs: litter disposal, disinfection, maintenance (approximately XAF 200,000–400,000)
Cash Flow Reserve Requirements
The cash flow analysis reveals that the farm requires a minimum cash reserve of XAF 4.0–4.5 million to survive the rearing period before egg revenue begins. This reserve must be accessible in liquid form — not invested in CAPEX — at the time of chick placement.
Many farms that fail in the first cycle do not fail because the business model is wrong. They fail because the farmer spent all available capital on infrastructure, leaving insufficient cash reserve for the rearing period feed costs. The infrastructure exists. The birds arrive. The cash runs out in week 8.
Cash flow resilience measures:
- Maintain a minimum 6-week feed reserve at all times during the laying period. At 115 kg/day × XAF 345/kg, this means holding XAF 1,424,000 worth of feed or feed credit in reserve at all times. A sudden feed price spike or supply disruption cannot be allowed to interrupt feeding.
- Invoice and collect egg payments within 7 days. Customers who pay monthly create a 30-day cash flow gap that requires additional working capital to bridge. Weekly collection is the standard for maintaining positive cash flow at a 1,000-bird scale.
- Maintain a cash buffer of 3× daily cost at all times during lay. At XAF 50,000/day in costs, this means XAF 150,000 in accessible cash at all times — available for emergency veterinary costs, equipment repair, or supply shortfalls without interrupting production.
Part 4: The Profitability Improvement Levers
Understanding ROI and break-even is the diagnostic framework. The levers that improve them are the management decisions.
Lever 1: Egg Price (Highest Impact)
As the sensitivity analysis showed, a XAF 20 increase in average egg price from XAF 140 to XAF 160 adds XAF 7.06 million to net profit per cycle — more than any other single management intervention. This requires:
- Supplying hotel and restaurant buyers who pay XAF 160–220 per egg for a consistent, graded supply
- Achieving and maintaining yolk color DSM 11–13 through the pigmentation program
- Packaging eggs in labeled, branded trays to command retail premium
- Establishing a direct relationship with at least one premium buyer before the first cycle begins
Lever 2: Laying Rate (Second Highest Impact)
Every 1 percentage point of average laying rate across the cycle adds approximately 1,800 saleable eggs, worth XAF 252,000 at XAF 140/egg. The difference between a 75% average and an 85% average laying rate is XAF 2,520,000 in revenue at constant price — a difference attributable entirely to management: lighting program consistency, disease prevention, nutrition, and uniform pullet development.
Lever 3: Feed Cost Reduction (Third Highest Impact)
Feed is 73–78% of OPEX. A 10% feed cost reduction saves XAF 1,520,000–1,925,000 per cycle. Routes to reduction:
- On-farm mixing where reliable ingredient sourcing exists: 15–25% cost reduction vs. a complete commercial ration at scale above 500 kg/day feed consumption
- FCR improvement through heat stress management, water quality, and feed wastage control: 10% FCR improvement saves approximately 10% of total feed cost
- Ingredient sourcing diversification — buying maize directly from farmers at harvest season vs. from traders at peak demand reduces maize cost by 10–20% for farms with storage capacity
Lever 4: Market Channel Diversification (Risk Reduction)
The risk management case for multiple market channels is as important as the revenue optimization case. A farm with 100% of production committed to a single wholesale buyer is exposed to that buyer’s pricing power. The buyer who knows you have no alternative will compress the price toward break-even over time.
The target distribution for a 1,000-bird farm is:
- 40–50% to a primary wholesale buyer or hotel supply contract (volume, consistency)
- 25–35% to open market direct retail (price premium, no single-buyer dependency)
- 15–25% to households, restaurants, or small businesses (highest per-egg price, but highest collection effort)
Lever 5: Cycle Efficiency (CAPEX Recovery Speed)
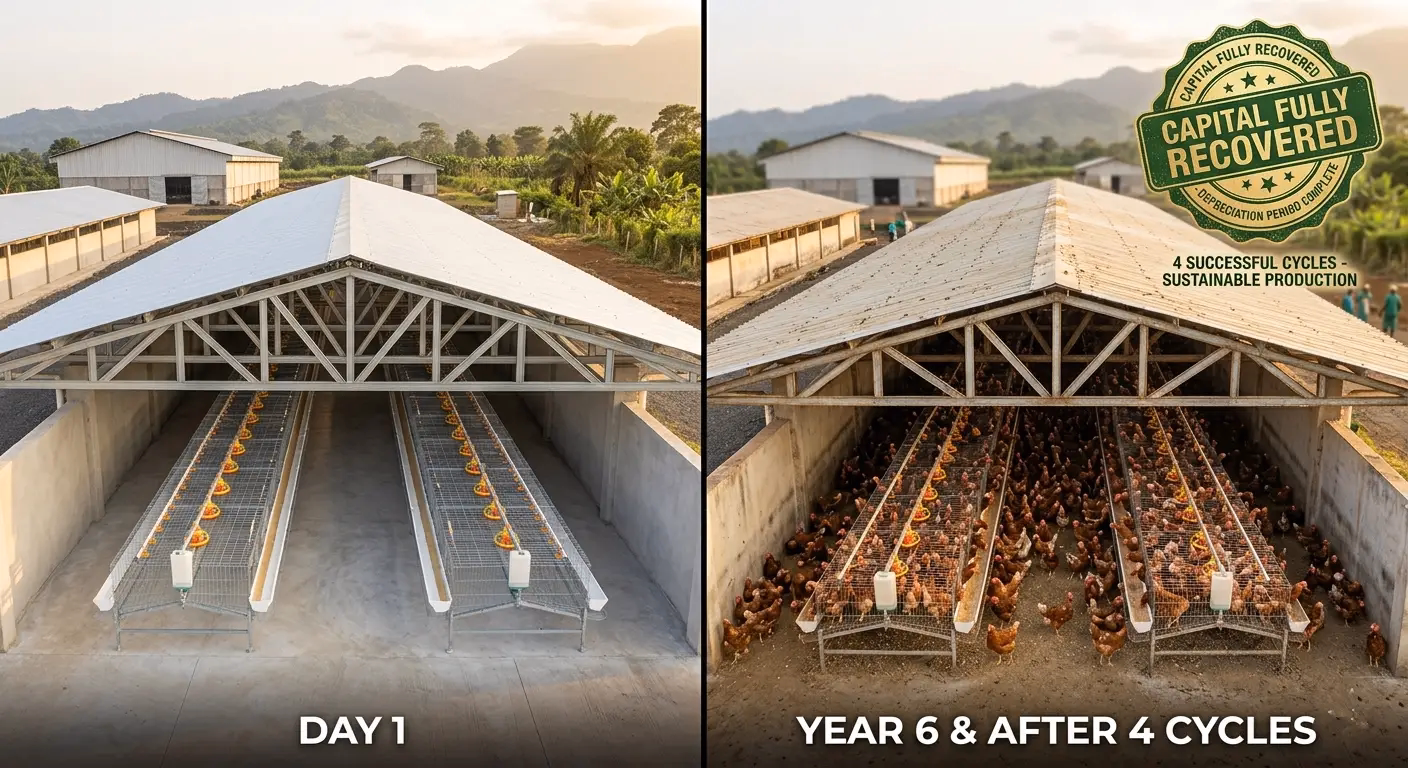
The faster CAPEX is recovered — through more cycles over the infrastructure’s useful life — the lower the CAPEX allocation per cycle and the higher the net profit per cycle. A farm that runs 4 cycles in 6 years (72-week cycles with 6-week cleanouts) recovers CAPEX in 4 cycles. A farm that runs 3 cycles due to management delays, extended cleanouts, and rearing failures recovers the same CAPEX in 3 cycles — a 33% higher CAPEX cost per cycle.
Minimizing downtime between cycles and maintaining production schedule discipline directly improves CAPEX recovery efficiency and long-term farm ROI.

Building Your Own ROI and Break-Even Model
The calculations in this article are based on a specific set of assumptions. Your farm’s actual ROI and break-even points will differ based on your specific costs and market prices. The following worksheet structure allows you to input your own figures:
Your ROI Calculation Worksheet
Investment:
- Your total CAPEX: ______
- Your initial working capital needed: ______
- Your Total Investment: ______
Revenue:
- Your average egg price per egg: ______
- Your estimated saleable eggs per cycle (birds × average lay rate × 504 days × 0.97): ______
- Your spent hen revenue: ______
- Your Total Revenue: ______
Costs:
- Your total OPEX per cycle: ______
- Your CAPEX depreciation allocation per cycle: ______
- Your Total Costs: ______
Results:
- Your Net Profit = Total Revenue − Total Costs: ______
- Your ROI (%) = (Net Profit ÷ Total Investment) × 100: ______
- Your Break-Even Price per Egg = Total Costs ÷ Saleable Eggs: ______
- Your Break-Even Laying Rate = (Total Daily Costs ÷ Egg Price ÷ Laying Hens) × 100: ______
Run this calculation before purchasing chicks. If your break-even price exceeds the market price available to you — or if your break-even laying rate exceeds 60% of your target — the business model requires revision before money is committed.
Common Financial Mistakes in Layer Farm Management
Mistake 1 — Confusing revenue with profit. The XAF 42 million in egg sales is not profit. After costs, the net profit is XAF 13–22 million. Spending against revenue rather than profit produces cash flow crises.
Mistake 2 — Not calculating break-even before starting. A farmer who discovers that their break-even price is XAF 72 per egg and their market offers XAF 120 per egg knows they have a 67% price buffer. A farmer who discovers this after three months of production could have known it on day one — with a 20-minute calculation.
Mistake 3 — Treating the rearing period as having zero cost. The 18 weeks before the first egg revenue consume XAF 3.9–4.5 million. This is not free. It is the most capital-intensive period of the cycle and the period most likely to cause cash flow failure in under-capitalized farms.
Mistake 4 — Using a single market channel and accepting its price. A farm with one buyer has no pricing power. Market diversification is not optional at commercial scale — it is the mechanism through which farmers capture the margin above break-even that makes the enterprise profitable.
Mistake 5 — Ignoring CAPEX recovery in profitability calculations. A farm that calculates profitability as Revenue minus OPEX without including depreciation is overestimating profit. The infrastructure wears out. Replacement must be funded from operating profit, not treated as a free asset in perpetuity.
Summary
ROI and break-even analysis are not academic exercises. They are the two calculations that determine whether a layer farm is genuinely viable before capital is committed — and the two tools that tell a farmer, every month of the production cycle, whether the farm is on track or drifting toward loss.
The base case 1,000-bird farm in West or Central Africa generates an annualized ROI of approximately 100–130% on total investment — exceptional by any investment standard. That return requires achieving 80%+ average laying rate, maintaining costs within budget, and accessing markets that pay above XAF 130 per egg.
Every percentage point of laying rate below target reduces net profit by XAF 252,000 per cycle. Every XAF 20 drop in average egg price reduces net profit by XAF 7 million per cycle. Every week of unnecessary downtime between cycles reduces CAPEX recovery efficiency.
Know your numbers. Calculate your break-even point before you spend your capital. Build your market access before you buy your birds. Manage toward your ROI target every month — not every cycle.
The farm that runs on data makes money. The farm that runs on hope runs out of money.
Download the analysis in PDF here is the link: Ottos_Farms_Layer_Economics.pdf