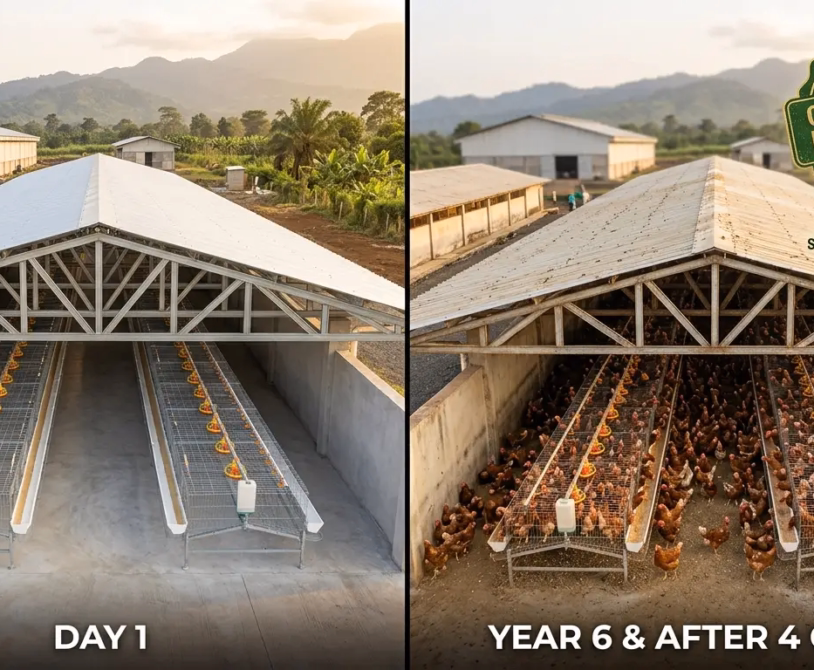
A multi-age layer farm is not a single operation. It is several concurrent production cycles at different stages — a flock at week 4 of rearing in House 1, a flock at week 30 of lay in House 2, a flock at week 60 in House 3 — each requiring different management inputs, generating different production data, and carrying different financial profiles. The farm that manages all of them from memory and a loose collection of unmarked notebooks is not managing them at all. It is reacting to whatever becomes most urgent.
Record keeping is the system that makes a multi-age layer farm manageable rather than chaotic. It is not a compliance requirement or a bureaucratic overhead. It is the infrastructure that converts the daily activity of the farm — eggs collected, feed weighed, birds dead, vaccines administered — into management information that can be acted on. The farm manager who can look at a record and know that House 3’s FCR has been rising for three consecutive weeks while House 1’s is stable has specific, actionable information. The manager who relies on memory and impression has an opinion.
This article builds the complete record-keeping system for a multi-age layer farm: the specific records required at each management level, the daily and weekly data collection protocols, the reporting structures that make patterns visible across flocks, and the principles that determine which records justify the time they cost to maintain.
The Record Keeping Hierarchy: Three Levels of Data
Multi-age layer farm records exist at three levels, each with a different frequency, purpose, and user:
Level 1 — Daily Operational Records: Collected by farm staff daily at each house. High frequency, low analytical complexity. Purpose: track what happened today.
Level 2 — Weekly Performance Records: Compiled by the farm manager weekly from Level 1 data across all houses. Purpose: identify trends and deviations from targets across the flock.
Level 3 — Cycle Summary Records: Compiled at depopulation and cycle transition. Purpose: evaluate complete cycle performance, diagnose root causes of any underperformance, and set targets for the next cycle.
The three levels form a pyramid: Level 1 generates the data, Level 2 converts it into trend information, and Level 3 converts trends into learning. A farm that only maintains Level 1 data has a detailed diary. A farm that maintains all three has a management intelligence system.
Level 1: Daily Operational Records
Record 1.1 — Daily Egg Production Log
This is the most fundamental record on the farm. It is maintained separately for each house and records every egg collected at every collection round.
Minimum data points per collection round:
| Field | What It Records |
|---|---|
| Date | Calendar date |
| House number | Unique house identifier |
| Collection time | Morning / Midday / Afternoon |
| Total eggs collected | Count of all eggs at this collection |
| Cracked/broken eggs | Count of structurally compromised eggs (separately counted) |
| Soft-shelled eggs | Any egg with gross deformity (double-yolk confirmed, extreme misshapen shell, blood spots visible externally) |
| Floor eggs | Any egg with gross deformity (double-yolk confirmed, extreme misshapen shell, blood spots visible externally) |
| Abnormal eggs | Any egg with gross deformity (double-yolk confirmed, extreme misshaped shell, blood spots visible externally) |
| Collector name | Which staff member completed this collection |
End-of-day summary calculations (compiled from all collection rounds):
- Total saleable eggs = Total collected − Cracked − Soft-shelled − Abnormal
- Cracked egg rate (%) = Cracked ÷ Total collected × 100
- Floor egg rate (%) = Floor eggs ÷ Total collected × 100
- Hen-day production rate (%) = Total collected ÷ Birds in house that day × 100
The production rate calculation requires knowing exactly how many birds are currently in each house, which comes from Record 1.2.
Why multiple collection rounds must be recorded separately: A flock that produces 80% of its eggs in the morning collection and only 20% in the afternoon is normal. A flock that shifts to 50% morning / 50% afternoon collection over two weeks has changed its laying pattern — which may indicate a lighting timing change, a calcium supply change affecting overnight shell formation, or a behavioral shift from nest box use (morning) to floor laying (afternoon). This information is only visible when collection rounds are recorded separately, not just as a daily total.
Record 1.2 — Daily Mortality and Bird Count Log
Bird count is the denominator in the production rate calculation. Without an accurate daily bird count, the production rate calculation produces meaningless numbers.
Daily mortality log per house:
| Field | Data |
|---|---|
| Date | Calendar date |
| House number | Unique identifier |
| Birds alive at the end of the day | Previous day’s closing count |
| Birds found dead (AM round) | Count and location in the house |
| Birds found dead (PM round) | Any birds deliberately removed due to injury, chronic illness, or non-production |
| Birds culled | Brief description: e.g., “sudden death, no gross signs,” “egg peritonitis,” “trauma,” “unknown — submit for PM.” |
| Birds removed/transferred | Any birds moved to another house or sold live |
| Birds alive at the end of the day | Opening count − Deaths − Culls − Transfers |
| Provisional cause of death | Birds alive at the end of day |
The provisional cause of death field is the Level 1 contribution to disease intelligence. It does not require a full post-mortem examination for every bird — only a brief external observation. Over time, this record reveals whether mortality causes are consistent (one cause, stable rate = background mortality), shifting (new cause appearing = developing disease event), or geographically clustered (mortality concentrated at one end of the house = environmental or management zone problem).
Record 1.3 — Daily Feed Record
Feed is the highest cost on the farm. It is also the variable most directly linked to FCR — the efficiency metric that determines whether the farm is profitable. Daily feed records are the data source for FCR calculation.
Per house, per day:
| Field | Data |
|---|---|
| Date | Calendar date |
| House number | Unique identifier |
| Feed in storage at start of day (kg) | Weighed inventory at day start |
| Feed delivered today (kg) | Weighed at delivery, from the invoice, or internal weighing |
| Feed in storage at end of day (kg) | Weighed inventory at the start of the day |
| Feed consumed today (kg) | Start stock + Delivered − End stock |
| Feed form | Crumble / Mash / Pellet |
| Ration type | Starter / Grower / Developer / Pre-lay / Layer |
| Supplier/batch number | For traceability if a quality problem is suspected |
Why weighing matters more than invoice-based tracking: A feed delivery invoice states 25 bags of 50 kg = 1,250 kg. Actual weight of 25 bags at delivery may be 1,190–1,230 kg due to moisture variation, bag short-fill, and transport settlement. Over 17 months, the difference between invoice-based and weighed tracking can be 500–1,000 kg, large enough to meaningfully distort FCR calculations. Weigh every delivery.
Record 1.4 — Water Consumption Record
Water intake is the first indicator to change when birds are stressed by disease, heat, or palatability problems. Recording daily water intake alongside feed intake reveals the water-to-feed ratio, which should be approximately 1.7–2.0:1 by weight under normal conditions and rises toward 3.0–4.0:1 during heat stress periods.
Per house, per day:
| Field | Data |
|---|---|
| Water meter reading at start (liters) | If metered or measured by header tank level |
| Water meter reading at end (liters) | — |
| Water consumed today (liters) | Difference between readings |
| Water-to-feed ratio | Water consumed ÷ Feed consumed |
| Water temperature at nipple (°C) | Water meter reading at the end (liters) |
| Any water supply interruptions | Yes/No; if yes, duration |
A water-to-feed ratio rising above 2.5:1 without a heat event is an early disease indicator — particularly for kidney disease (IBV nephropathogenic strain), salt toxicity, or gastrointestinal challenge. A ratio falling below 1.5:1 indicates water access restriction, palatability problem, or clinical illness. Both deviations appear in this record before they appear in mortality or production data.
Record 1.5 — Daily Behavioral and Environmental Observation Log
This is the record that captures the qualitative information that numbers cannot. It takes 5 minutes to complete and is the farm manager’s early warning system.
Per house, per day (completed during the morning flock health walk-through):
- Flock behavior: Normal / Lethargic / Restless / Huddling
- Appetite at morning feed: Normal / Reduced / Absent
- Respiratory sounds: None / Mild rattle / Significant respiratory distress
- Droppings observation: Normal / Loose / Diarrhea / Blood-tinged
- Any birds with specific clinical signs: Yes/No — if yes, describe and record cage location
- House temperature at bird level (°C): Three-point measurement (front, middle, rear)
- House ammonia estimate: Below 10 ppm / 10–20 ppm / Above 20 ppm
- Litter condition (for floor-system houses): Dry / Moist / Wet patches — locations noted
This record converts daily observation from an informal walk-through into a documented time series. A behavioral change noted on a Thursday — “approximately 15% of birds in House 2 showing mild respiratory sounds” — that appears in Monday’s record as “50% of birds in House 2 showing respiratory distress and mortality rate 0.4% today” tells a story that is only complete because Thursday’s observation was written down.
Level 2: Weekly Performance Records
Level 2 records are compiled every Monday morning (or at a set weekly schedule) from the preceding week’s Level 1 data. They exist at the farm level — comparing all houses simultaneously — rather than at the house level.
Record 2.1 — Weekly Production Performance Summary
This is the master weekly report. It takes 20–30 minutes to compile and contains the most important performance information on the farm.
Format: One row per house, updated weekly:
| House | Age (wks) | Breed | Birds Start | Birds End | Mortality % | Eggs Collected | Saleable Eggs | Laying Rate % | Breed Target | Variance | Cracked % | Floor Egg % |
|---|---|---|---|---|---|---|---|---|---|---|---|---|
| H1 | 8 | LBB | 980 | 976 | 0.04% | — (rearing) | — | — | — | — | — | — |
| H2 | 32 | LBB | 950 | 947 | 0.03% | 6,573 | 6,441 | 97.0% | 92% | +5.0% | 1.7% | 0.9% |
| H3 | 58 | ISA | 900 | 893 | 0.08% | 5,340 | 5,205 | 81.3% | 78% | +3.3% | 2.5% | 1.4% |
| H4 | 71 | LBB | 820 | 812 | 0.10% | 4,460 | 4,284 | 72.2% | 68% | +4.2% | 3.9% | 2.1% |
| Farm Total | — | — | 3,650 | 3,628 | 0.06% | 16,373 | 15,930 | — | — | — | 2.5% | 1.3% |
Breed Target column: Enter the breed management guide’s expected laying rate for each house’s current age. This makes the variance column immediately diagnostic — a positive variance means the house is outperforming breed expectation; a negative variance means it is underperforming and requires investigation.
The farm total row: The aggregate farm performance across all houses gives the overall business performance picture. Farm-level eggs per day, farm-level mortality rate, and farm-level cracked egg rate are the numbers that drive weekly revenue calculations and monthly financial reporting.
Record 2.2 — Weekly FCR Calculation
FCR must be calculated weekly per house to identify efficiency trends as they develop.
Per house, weekly:
| House | Feed Consumed (kg) | Egg Mass (kg) | FCR (egg mass) | Feed Cost (XAF) | Revenue (XAF) | Gross Margin/kg Egg (XAF) |
|---|---|---|---|---|---|---|
| H2 (32 wks) | 666 | 419 | 1.59 | 233,100 | 1,028,800 | 1,898 |
| H3 (58 wks) | 624 | 338 | 1.85 | 218,400 | 854,400 | 1,908 |
| H4 (71 wks) | 570 | 279 | 2.04 | 199,500 | 685,440 | 1,736 |
Interpreting the FCR trend: A House 3 FCR of 1.85 at week 58 is within the acceptable late-mid-lay range. If the previous three weeks showed FCR of 1.72, 1.78, 1.85 — a rising trend — that is a diagnostic signal: egg weight may be declining (check average egg weight), or feed intake may be increasing without proportional production gain (check water intake and heat stress data). The trend is the information, not the single weekly figure.
Record 2.3 — Weekly Health Event Summary
A single place where all health events across all houses in the previous week are recorded:
| Date | House | Event Type | Birds Affected | Action Taken | Follow-up Required |
|---|---|---|---|---|---|
| Mon | H4 | Mortality spike: 8 birds (vs. avg 2) | Post-mortem: E. coli peritonitis (3), sudden death (3), undetermined (2) | Collected samples for bacteriology, increased observation frequency | Lab result pending |
| Wed | H2 | Sticky trap: 380 mites/trap (vs. threshold 200) | Scheduled acaricide treatment for Saturday | Confirm treatment completion | |
| Fri | All | Newcastle disease vaccination (La Sota, drinking water) | All 3 laying houses vaccinated, H1 rearing by eye drop | Serology check at week 4 post-vaccination |
This record builds the health event timeline that is essential for post-outbreak investigation (“what happened in the two weeks before the disease event?”) and for insurance or veterinary consultation documentation.
Record 2.4 — Weekly Financial Summary
A farm-level financial snapshot compiled weekly:
| Item | This Week (XAF) | This Week (USD) | Month to Date (XAF) | Month to Date (USD) |
|---|---|---|---|---|
| Egg revenue | 2,228,200 | 3,714 | 8,912,800 | 14,855 |
| Spent hen revenue | — | — | — | — |
| Total Revenue | 2,228,200 | 3,714 | 8,912,800 | 14,855 |
| Feed cost | 650,700 | 1,085 | 2,602,800 | 4,338 |
| Health inputs | 85,000 | 142 | 340,000 | 567 |
| Labor | 113,000 | 188 | 452,000 | 753 |
| Utilities | 48,000 | 80 | 192,000 | 320 |
| Other | 22,000 | 37 | 88,000 | 147 |
| Total Costs | 918,700 | 1,531 | 3,674,800 | 6,125 |
| Gross Weekly Profit | 1,309,500 | 2,182 | 5,238,000 | 8,730 |
| Feed cost as % of revenue | 29.2% | — | 29.2% | — |
The feed cost as a percentage of revenue is the single most important weekly financial ratio. At a healthy operation, this ratio should be 28–35% in peak lay. When it rises above 40%, the farm’s cost structure is being compressed by either rising feed prices, declining production, or declining egg prices — and the source of the compression must be identified.
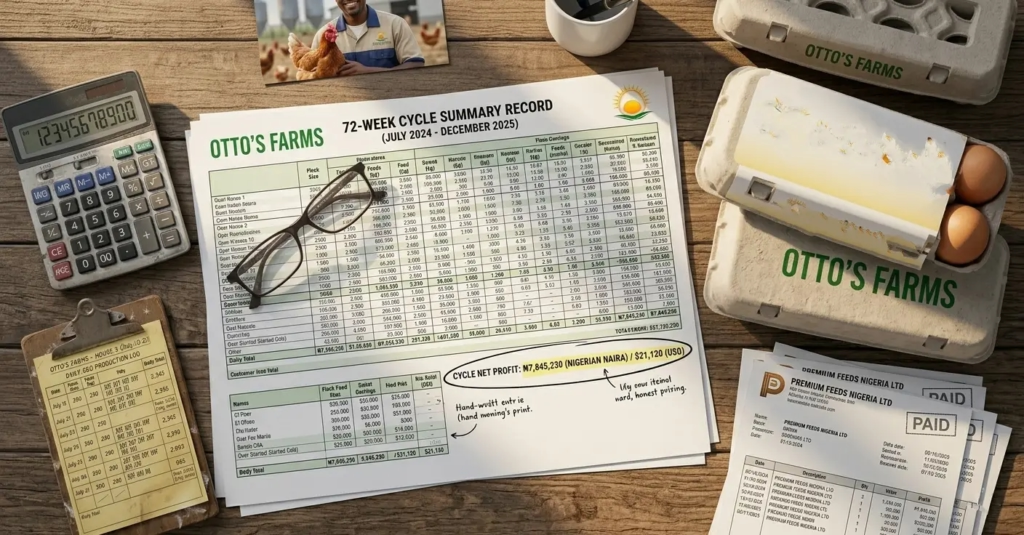
Level 3: Cycle Summary Records
Cycle summary records are compiled at depopulation and house cleanout. They are retrospective performance evaluation that determines the targets and design decisions for the next flock.
Record 3.1 — Full Cycle Production Summary
Compiled from all 17–18 months of Level 1 and Level 2 records:
| Metric | Target | Actual | Variance | Root Cause (if negative) |
|---|---|---|---|---|
| Total birds housed | 1,000 | 980 | −20 (chick quality) | Hatchery omphalitis rate 2.1% — notify supplier |
| Rearing mortality (%) | 5% | 6.2% | +1.2% | Gumboro challenge at week 3 — review vaccination timing |
| Laying mortality (%) | 5% | 7.8% | +2.8% | E. coli peritonitis spike weeks 24–30 — review biosecurity |
| Peak laying rate (%) | 92% | 88% | −4% | Lighting disruption at week 22 — timer failure |
| Average laying rate (full cycle) | 80% | 76.5% | −3.5% | Combined effect of above events |
| Total eggs produced | 353,000 | 335,000 | −18,000 | — |
| Total saleable eggs | 342,000 | 320,800 | −21,200 | Cracked egg rate 4.2% (above 3% target) — nest box review |
| Average egg weight (g) | 62 | 60.5 | −1.5g | Pre-lay calcium transition — review timing |
| FCR (egg mass, peak) | 2.05 | 2.18 | +0.13 | High FCR associated with E. coli period + heat stress |
| FCR (full cycle) | 2.15 | 2.31 | +0.16 | Reflects a combination of the above |
| Total egg revenue (XAF) | 47,880,000 | 44,912,000 | −2,968,000 | — |
| Total egg revenue (USD) | 79,800 | 74,853 | −4,947 | — |
| Total feed cost (XAF) | 17,250,000 | 18,906,000 | +1,656,000 | Higher FCR × higher consumption |
| Total feed cost (USD) | 28,750 | 31,510 | +2,760 | — |
| Cycle net profit (XAF) | 22,500,000 | 19,862,000 | −2,638,000 | — |
| Cycle net profit (USD) | 37,500 | 33,103 | −4,397 | — |
This record converts a 17-month production cycle into a single-page performance diagnostic. The root cause column — completed with honesty — is the most valuable information on the farm for improving the next cycle. Without it, the same mistakes recur because there is no institutional memory of what caused them.
Record 3.2 — Vaccination and Health Event Chronology
A full timeline of every health input and health event across the cycle, compiled in date order:
- Date of every vaccination: vaccine product, batch number, route, dosage, administrator
- Date of every disease event: provisional diagnosis, severity (% birds affected), treatment administered
- Date of every laboratory submission: sample type, laboratory, test requested, result, interpretation
- Date of every antibiotic treatment: product, dose, route, duration, withdrawal period applied
- Date of every post-mortem examination: bird count examined, primary findings, action triggered
This chronology is the audit trail for food safety compliance, the basis for regulatory notification if required, and the clinical history that a new veterinarian needs to understand the farm’s health background.
Record 3.3 — Financial Cycle Reconciliation
The complete financial statement for the cycle, reconciling every input cost against revenue:
Revenue:
- Egg sales by channel (wholesale, hotel, retail, direct) with volume and price per channel
- Spent hen sales
- Total revenue (XAF and USD)
Operating Costs:
- Feed: total kg consumed × average price paid per kg
- Health inputs: itemized by category (vaccines, antiparasiticides, antibiotics, supplements)
- Labor: total wages paid
- Utilities: total electricity, water, generator fuel
- Consumables and miscellaneous
Capital allocation:
- CAPEX depreciation for this cycle (house, cages, equipment)
Net Profit:
- Revenue − OPEX − CAPEX depreciation
- Expressed as XAF total and XAF/month equivalent
- Expressed as USD total and USD/month equivalent
- ROI calculated against total capital deployed
Record 3.4 — Next Cycle Planning Notes
Compiled at the end of each cycle summary:
- What three management improvements have the highest expected impact on next cycle performance?
- What infrastructure repairs or upgrades are required before the next cycle?
- What market channel changes are planned (new buyer relationships, pricing adjustments)?
- What vaccine program changes are indicated by this cycle’s health event chronology?
- What is the target placement date for the next flock, calibrated to the seasonal demand cycle?
This record is the bridge between retrospective evaluation and prospective planning. Without it, the cycle summary remains historical data. With it, every cycle’s learning is converted into the next cycle’s competitive advantage.
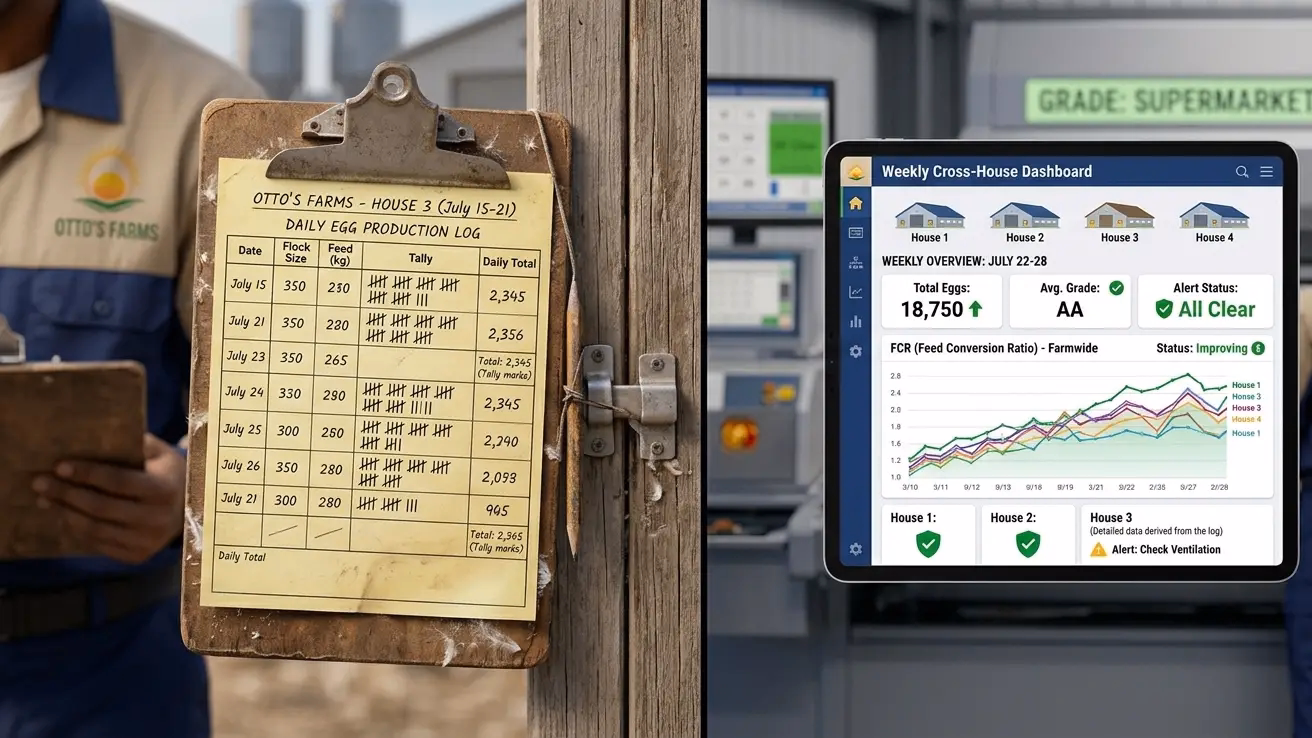
Multi-Flock Coordination: The Cross-House Dashboard
When multiple houses are at different production stages simultaneously, the most important management tool is a single-page cross-house dashboard that shows every house’s current status at a glance.
The Weekly Cross-House Dashboard
| House | Stage | Age (wks) | Breed | Birds | Laying Rate | vs. Target | FCR | Mortality Rate | Alert Status |
|---|---|---|---|---|---|---|---|---|---|
| H1 | Rearing | 6 | LBB | 976 | — | — | — | 0.04%/day | ⚠ Monitor (Gumboro due) |
| H2 | Early lay | 20 | LBB | 947 | 62% | −3% | 1.82 | 0.02%/day | ✓ Normal |
| H3 | Peak lay | 32 | ISA | 933 | 89% | −3% | 2.02 | 0.03%/day | ✓ Normal |
| H4 | Late lay | 58 | LBB | 893 | 79% | +1% | 2.18 | 0.07%/day | ✓ Normal |
| H5 | Very late lay | 70 | ISA | 812 | 70% | +2% | 2.31 | 0.10%/day | ⚠ Depopulate in 8 weeks |
Alert Status column: This is the most important column on the dashboard. It is the first thing the farm manager looks at every Monday morning. Three possible states:
- ✓ Normal: Performance within an acceptable range of targets; no action required beyond standard management
- ⚠ Monitor: Approaching a threshold or an upcoming management event that requires preparation (Gumboro vaccination due, mite count approaching treatment threshold, late-lay approaching economic depopulation point)
- 🔴 Action Required: Performance has breached a threshold that requires immediate investigation or intervention
The cross-house dashboard converts the entire farm’s status into a 5-minute weekly review. All of the Level 1 and Level 2 data flows into it. The manager who reviews this dashboard every Monday morning before the week’s management decisions are made is managing proactively. The manager who manages reactively — learning about the Gumboro vaccination being due when the disease appears, or the late-lay house being uneconomic when the feed invoice arrives — is managing from behind.

Digital vs. Paper Records: The Right Tool for the Farm’s Scale
Paper Records (Recommended: Stage 1–2, up to 1,000 birds)
A well-organized paper record system — using the templates described in this article, kept in a dedicated farm binder with one section per house — is adequate and appropriate for farms at Stage 1 and Stage 2 (up to 1,000 birds). Paper records:
- Requires no technology investment
- Are accessible to staff with limited digital literacy
- Are immune to technology failure (power outages, software updates, hardware failure)
- Are legally admissible as primary documents for tax, regulatory, and insurance purposes
The critical requirement for paper records is that they are completed in real time — at the point of observation — not reconstructed from memory at the end of the day or week. A paper record completed 6 hours after the observation being recorded is not a record. It is a recollection.
Spreadsheet Records (Recommended: Stage 2–3, 1,000–5,000 birds)
Google Sheets or Microsoft Excel records offer:
- Automatic calculation of derived metrics (FCR, mortality rate, production rate)
- Trend charting from accumulated data
- Cross-house comparison with a single view
- Remote access for multi-site operations
The minimum setup: one spreadsheet workbook per flock cycle, with one tab per house for Level 1 data, one tab for the weekly Level 2 summary, and one tab for the cycle financial record.
Cloud-based spreadsheets (Google Sheets) provide automatic backup and multi-user access — the farm manager can review data remotely while a staff member completes the daily entry.
Farm Management Software (Recommended: Stage 3–4, 5,000+ birds)
Purpose-built poultry farm management software (Agrosoft, Porphyrio, PIGS, and similar platforms with sub-Saharan African deployments) automates Level 2 and Level 3 compilation from Level 1 data entry, provides benchmarking against industry standards, and integrates financial accounting with production records.
Investment is justified at 5,000+ birds when the labor savings from automated reporting exceed the software subscription cost — typically above XAF 200,000 (USD 333) per year, which most commercial software platforms cost at this scale.
The Most Important Record Keeping Principle
More records are not better records. The record system that is consistently maintained provides more management value than a theoretically comprehensive system that staff completes sporadically because it is too time-consuming.
The minimum viable record system for a multi-age layer farm is:
- Level 1: Daily production log, daily mortality log, daily feed record
- Level 2: Weekly production performance summary, weekly FCR calculation
- Level 3: Cycle summary and next cycle planning notes
Everything else in this article is an enhancement of that minimum. Add records when the management decision they enable is worth more than the time they cost to maintain. Remove records that are never reviewed or never influence a management decision.
A record that has never changed a management decision is not a management tool. It is an administrative habit. Evaluate every record on the system annually: “Did this record change how I managed the farm in the past 12 months?” If not, simplify or eliminate it.
Summary
Record keeping for a multi-age layer farm is the infrastructure of management intelligence. Without it, the farm manager is making decisions based on impression, memory, and the most recent event — all of which are unreliable in proportion to the farm’s complexity.
The three-level system — daily operational records, weekly performance summaries, and cycle retrospective records — provides the data at the right frequency and the right level of aggregation for the decision it supports. Daily records support today’s operational response. Weekly records support this week’s management adjustments. Cycle records support the next cycle’s design.
The farms that improve consistently across production cycles are not the farms with the most talented farmers. They are the farms with the best institutional memory — where every cycle’s performance is measured against a target, every deviation is diagnosed with a root cause, and every root cause improvement is implemented before the next flock arrives.
Records are that institutional memory. Maintain them. Review them. Let them change how you farm.
Download the analysis in PDF here is the link: Ottos_Farms_Record_Keeping_Guide.pdf