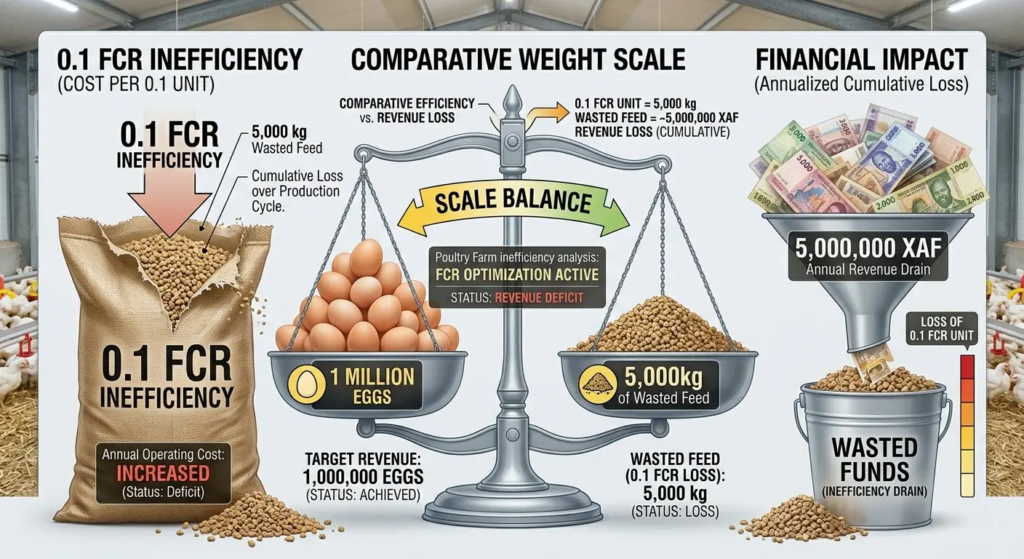
Feed accounts for 65–75% of the total variable cost of producing an egg. In a commercial layer operation producing 1 million eggs per year, a difference of 0.1 in feed conversion ratio represents approximately 4,000–5,000 kg of feed consumed with no corresponding increase in revenue. At current feed prices across West and Central Africa, that 0.1 gap costs between XAF 3–5 million per year in a mid-sized operation.
Most layer farmers know their FCR is important. Fewer calculate it correctly. Fewer still use the calculation to identify the specific variable ratios, energy density, feed access consistency, body weight versus breed standard, and water intake that are responsible for the gap between their current FCR and the genetic potential of their breed.
Feed calculators are the tool that converts FCR from a performance number into a diagnostic instrument. They do not replace agronomic judgment or veterinary expertise. They make both more precise by providing the quantitative framework within which judgment operates.
This article covers how to calculate layer FCR correctly, what the number means at each production phase, how feed calculators work and what they reveal, and how to use that information to close the efficiency gap between actual and potential performance.
What FCR Actually Measures in Layer Production
Feed conversion ratio in broiler production is straightforward: kilograms of feed consumed divided by kilograms of live weight gained. In layer production, FCR has two distinct expressions that measure different things and must not be confused.
FCR by Egg Mass (The Production Efficiency Metric)
FCR (egg mass) = Total feed consumed (kg) ÷ Total egg mass produced (kg)
This is the primary production efficiency metric for layer operations. It measures how many kilograms of feed are required to produce one kilogram of egg — integrating laying rate, egg weight, and feed intake into a single number. It captures the full economic reality of layer feed efficiency because eggs are sold by unit, but their commercial value is primarily determined by weight grade.
Breed standard FCR by egg mass:
| Production Phase | Lohmann Brown Classic | Hy-Line Brown | ISA Brown |
|---|---|---|---|
| Early lay (Wk 18–30) | 2.1–2.3 | 2.1–2.2 | 2.0–2.2 |
| Peak lay (Wk 30–50) | 2.0–2.2 | 2.0–2.1 | 1.9–2.1 |
| Late lay (Wk 50–72) | 2.2–2.5 | 2.2–2.4 | 2.1–2.4 |
A flock achieving an FCR of 2.0 (egg mass) during peak lay is performing at or near genetic potential. An FCR of 2.5 during the same period means the flock is consuming 25% more feed per kilogram of egg produced than it should — a gap of 0.5 that, at 10,000 birds consuming 115g per day, costs an additional 575 kg of feed per day.
FCR per Dozen Eggs (The Revenue Metric)
FCR (dozen) = Total feed consumed (kg) ÷ Total dozens produced
This metric is more useful for direct revenue comparison because eggs are typically sold by the tray or crate — units based on count, not weight. It allows the farmer to answer: “How much feed does it cost me to produce one tray of eggs?” — the metric most directly comparable to market price.
Breed standard FCR per dozen:
| Phase | Target FCR/Dozen |
|---|---|
| Early lay | 1.6–1.8 kg/dozen |
| Peak lay | 1.4–1.6 kg/dozen |
| Late lay | 1.6–1.9 kg/dozen |
An FCR of 1.5 kg per dozen means every dozen eggs produced requires 1.5 kg of feed. At a feed cost of XAF 350 per kg, the feed cost per dozen is XAF 525. If the market price per dozen is XAF 1,200, the feed cost represents 44% of revenue, leaving a narrow margin for all other operating costs. At an FCR of 1.8 kg/dozen, feed cost per dozen rises to XAF 630, compressing the margin further without any change in market price.
Both expressions of FCR should be calculated weekly and plotted against breed standards. The deviation between actual and standard tells you where efficiency is being lost.
The Four Variables That Determine Layer FCR
FCR is not a single variable — it is the outcome of four interacting variables, each of which can be measured and managed independently. Using a feed calculator effectively requires understanding which of these four is responsible for the current FCR gap.
Variable 1: Feed Intake
Daily feed intake per bird is the numerator in the FCR calculation. Birds that consume more feed than the ration’s nutrient density justifies — because they are over-fed, because the energy density of the ration is too low (forcing birds to eat more volume to meet energy needs), or because feed wastage is high — produce a higher FCR even when laying rate and egg weight are adequate.
Target daily feed intake for brown-egg commercial layers:
- Early lay: 105–110 g/bird/day
- Peak lay: 110–120 g/bird/day
- Late lay: 115–125 g/bird/day (intake increases as egg size increases and absorption efficiency declines)
Feed intake above the upper end of these ranges during any phase indicates either excess feed allocation, low ration energy density, or significant feed wastage. Feed intake below the lower end indicates water restriction, heat stress, disease challenge, or palatability problems — all of which suppress both intake and production simultaneously.
Variable 2: Laying Rate
Laying rate is the primary driver of FCR efficiency because maintenance energy — the energy required to keep the hen alive, thermoregulated, and mobile regardless of whether she lays an egg — is fixed. A hen that does not lay today consumes the same maintenance energy as a hen that did lay. The feed spent on the non-laying day is pure FCR inefficiency.
At 90% laying rate, 1 day in 10 is a non-production day where maintenance feed is consumed without productive output. At 80% laying rate, 2 days in 10 are non-production days. The FCR difference between an 80% and a 90% flock — all else equal — is approximately 0.2–0.3 egg mass FCR points. That gap closes directly when the laying rate is recovered.
Variable 3: Egg Weight
Egg weight is the denominator variable in egg mass FCR. Heavier eggs improve FCR because more egg mass is produced per kilogram of feed consumed — assuming egg weight increases are driven by albumen secretion (water and protein) rather than yolk size or shell thickness.
Water intake restriction reduces egg weight without reducing feed intake — the numerator stays the same while the denominator shrinks, directly worsening FCR. This is one of the clearest mechanisms by which water quality problems translate into FCR deterioration.
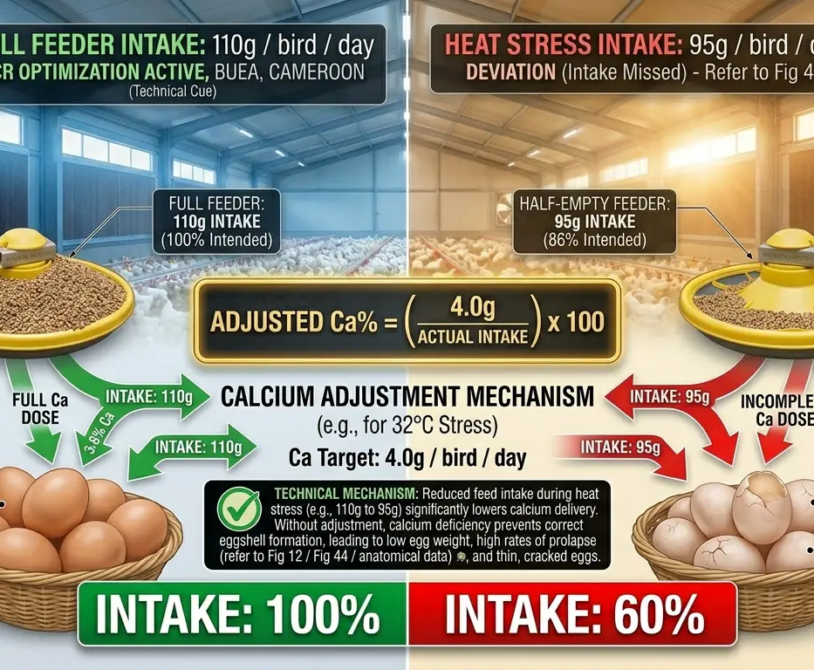
The egg weight contribution to FCR: Each 1-gram increase in average egg weight at constant laying rate reduces FCR (egg mass) by approximately 0.03–0.05 points at peak lay. Conversely, a 5-gram reduction in average egg weight (common in heat stress conditions) worsens FCR by 0.15–0.25 points — an effect size equivalent to a major feeding management failure.
Variable 4: Ration Energy Density
The metabolizable energy (ME) content of the ration determines how many grams of feed the hen must consume to meet her daily energy requirement. A ration with ME of 2,700 kcal/kg requires the hen to consume more grams per day than a ration with ME of 2,850 kcal/kg to achieve the same energy intake. The higher-volume consumption of the lower-energy ration worsens FCR even if nutrient-to-energy ratios are maintained.
Ration energy density in West African commercial layer operations frequently falls below design specifications due to:
- Local maize has lower starch content than international book values assume
- Moisture content of ingredients above specification (wet-season procurement)
- Fat or oil supplementation was omitted to reduce cost
- Mycotoxin contamination reduces ME availability from grain
Each of these reduces effective ME below the labelled or calculated value — forcing higher feed volume consumption, widening FCR, and increasing feed cost per dozen simultaneously.
How Feed Calculators Work: From Data Input to Diagnostic Output
A feed calculator for layer production takes measured farm data as inputs and returns calculated FCR values, feed cost per egg, and deviations from breed standards as outputs. The calculation is not complex — the value is in the structure it imposes on data collection and the comparisons it enables.
The Core Inputs
A complete layer feed calculator requires the following measured data at a minimum:
Flock data:
- Number of hens housed at start of period
- Mortality during period (to calculate hen-day average)
- Average live weight (measured, not estimated)
Production data:
- Total eggs collected during the period
- Total egg mass (if available) or average egg weight for the period
- Number of cracked, soft-shelled, or floor eggs (to calculate saleable egg production separately)
Feed data:
- Total feed delivered during period (weighed, not estimated from invoice quantity)
- Total feed remaining at the end of the period (weighed)
- Actual feed consumed = feed delivered − feed remaining
Calculated from inputs:
- Hen-day production rate (%) = Total eggs ÷ (Hen-days × 100)
- Daily feed intake per bird (g) = Total feed consumed (g) ÷ Hen-days
- FCR (egg mass) = Total feed consumed (kg) ÷ Total egg mass produced (kg)
- FCR (dozen) = Total feed consumed (kg) ÷ Total dozens produced
- Feed cost per dozen = FCR (dozen) × Feed cost per kg
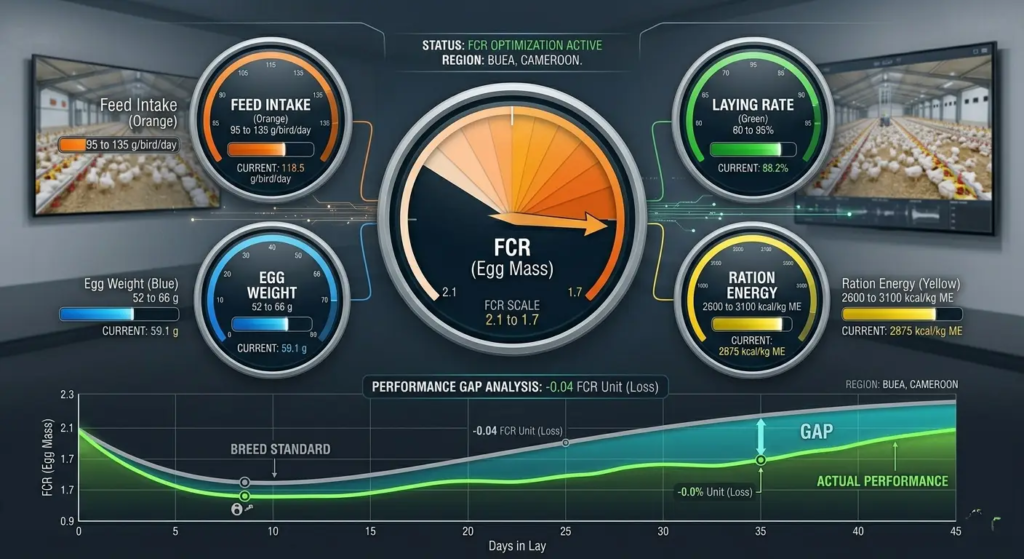
The Diagnostic Outputs
The value of a feed calculator is not the FCR number alone. It is the deviation analysis — comparing calculated actuals against breed standards to identify which variable is responsible for the gap.
A well-structured feed calculator diagnostic output looks like this:
| Metric | Actual | Breed Standard | Gap | Interpretation |
|---|---|---|---|---|
| Laying rate | 82% | 90% | −8% | Primary FCR driver |
| Avg egg weight | 60g | 63g | −3g | Water or nutrition issue |
| Daily feed intake | 118g | 115g | +3g | Slight overfeeding or wastage |
| FCR (egg mass) | 2.38 | 2.05 | +0.33 | Driven primarily by laying rate gap |
| Feed cost/dozen | XAF 612 | XAF 527 | +XAF 85 | Revenue impact per dozen |
This output tells the farmer: the FCR gap is primarily a laying rate problem, not a feed intake or egg weight problem. Investigating feed quantity or ration composition will not close the gap. Investigating what is suppressing laying rate — lighting, health, nutrition, uniformity — is where the investigation should focus.
Without the calculator, the farmer sees an FCR of 2.38 and adjusts the ration. With the calculator, the farmer sees that the ratio is not the primary problem — and investigates the right variable.
Building Your Own Feed Calculator: A Step-by-Step Framework
A feed calculator does not require software. It can be built in a paper ledger or a basic spreadsheet. The discipline of collecting the data and running the calculation weekly is what produces value — not the platform.
Weekly Data Collection Template
Header: Farm name | Flock ID | Breed | Age (weeks) | Period start date | Period end date (7 days)
Flock section:
- Birds at start of period: ___
- Mortality during period: ___
- Birds at end of period: ___ (= Start − Mortality)
- Hen-days: ___ (= Birds at start × 7, adjusted for daily mortality if tracked daily)
Production section:
- Total eggs collected: ___
- Cracked / soft-shelled / abnormal eggs: ___
- Saleable eggs: ___ (= Total − Abnormal)
- Total dozens: ___ (= Saleable ÷ 12)
- Average egg weight this week (g): ___ (weigh 30 eggs from three collection rounds, average the result)
- Total egg mass (kg): ___ (= Total saleable eggs × Average egg weight ÷ 1,000)
Feed section:
- Feed delivered this week (kg): ___
- Feed in storage at start of week (kg): ___
- Feed in storage at end of week (kg): ___
- Feed actually consumed (kg): ___ (= Opening stock + Delivered − Closing stock)
- Feed cost per kg (XAF): ___
Calculated outputs:
- Hen-day production rate (%): ___ (= Total eggs ÷ Hen-days × 100)
- Daily feed intake per bird (g): ___ (= Feed consumed × 1,000 ÷ Hen-days)
- FCR (egg mass): ___ (= Feed consumed ÷ Egg mass kg)
- FCR (dozen): ___ (= Feed consumed ÷ Dozens)
- Feed cost per dozen (XAF): ___ (= FCR dozen × Feed cost per kg)
- Cracked/abnormal egg rate (%): ___ (= Abnormal ÷ Total × 100)
The Comparison Step
After calculating, compare each output against:
- The breed standard for the current week of lay (use the breed management guide from your chick supplier)
- Your own flock’s previous week’s performance
- Your own flock’s same-week performance in the previous production cycle
Trend analysis — comparing the same metric week-over-week and cycle-over-cycle — reveals gradual efficiency changes that single-point calculations miss. An FCR drifting from 2.10 to 2.18 to 2.25 over three consecutive weeks is not a stable performance with a random variation. It is a trend with a cause. The calculator reveals the trend. The investigation finds the cause.
Interpreting FCR Deviations: What Each Gap Pattern Means
Not all FCR gaps look the same. The pattern of which variables are above or below standard identifies the likely cause, which determines the correct response.
Pattern 1: High Feed Intake + Normal Laying Rate + Normal Egg Weight = Ration Energy Issue
The hen is eating too much because the ration’s ME content is below design. She eats more volume to meet her energy requirement. Solution: audit ration ME through laboratory analysis of actual ingredient ME values, not book values. Check the moisture content of maize and soybean meal at the time of procurement. Verify fat or oil inclusion.
Pattern 2: Normal Feed Intake + Low Laying Rate + Normal Egg Weight = Production Problem
The ratio is correct. The bird is eating the right amount. She is not converting it into eggs. Investigation focus: lighting (photoperiod, intensity, dark period integrity), health (subclinical disease, vaccination gap, respiratory challenge), or flock uniformity (a proportion of non-laying birds pulling down the flock average).
Pattern 3: Normal Feed Intake + Normal Laying Rate + Low Egg Weight = Water or Protein Issue
The hen is laying frequently but producing small eggs. The most common cause is water restriction, reducing albumen secretion. Check water intake (measure water consumed per bird per day — should be 180–220 mL at ambient temperature below 25°C), water line pressure, drinker access ratio, and water quality. Secondary cause: methionine deficiency reducing albumen protein synthesis — check the ratio methionine + cystine against the breed standard requirement.
Pattern 4: Low Feed Intake + Low Laying Rate + Low Egg Weight = Environmental or Health Challenge
Everything is below standard simultaneously. This pattern indicates a systemic stressor — severe heat stress, significant disease challenge, or a major housing problem. Address the primary stressor first; the production metrics will not respond to nutritional intervention while the stressor is active.
Pattern 5: Normal Intake + Normal Laying Rate + Normal Egg Weight + Still Poor FCR = Calculation Error
If all three component variables appear normal but FCR is poor, the most likely explanation is a measurement error in one of the inputs — usually feed consumption (inventory not accurately tracked) or egg mass (average egg weight not measured, estimated too low). Recheck the data collection process before investigating production variables.
The Feed Wastage Variable: The Hidden FCR Killer
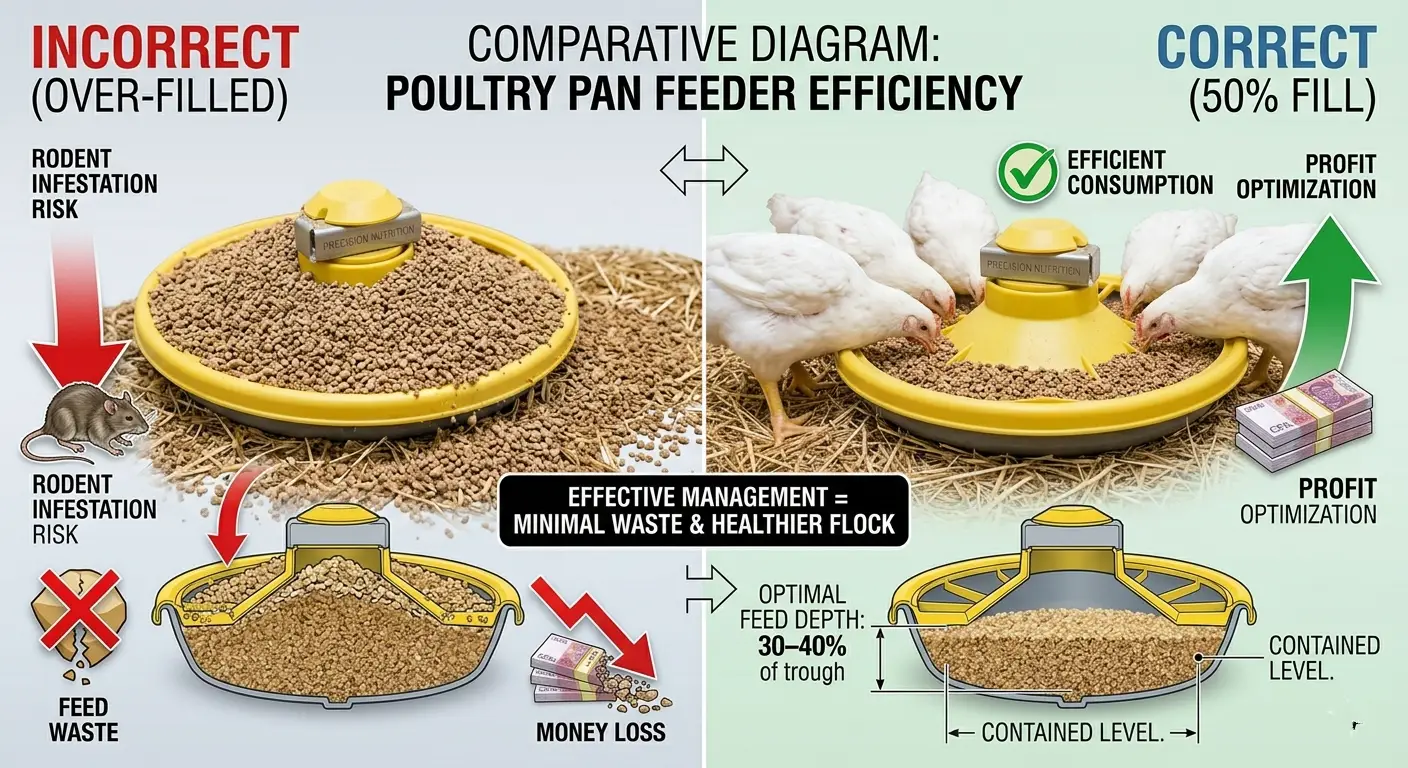
Feed wastage is the component of feed consumption that contributes to the FCR numerator without contributing to the denominator. Every gram of feed that falls from a feeder onto litter, is scattered by birds at an overfull feeder, or is consumed by rodents, is feed that increases the FCR calculation without producing a gram of egg.
Feed wastage rates in commercial layer houses:
- Well-managed operation with correct feeder fill depth and bird allocation: 2–4% of total feed delivered
- Poorly managed feeder fill depth (over-filled pan feeders, shallow chain feed): 8–12%
- Significant rodent pressure: 5–15% additional
At 10% wastage in a 5,000-bird operation consuming 575 kg of feed per day, 57.5 kg of feed per day is being consumed by litter and rodents. At XAF 350/kg, that is XAF 20,125 per day in wasted feed cost — XAF 6 million per year — appearing as FCR inefficiency with no corresponding egg production.
Measuring actual wastage: Spread a plastic sheet under a section of feeder at the end of a day before the evening feeding. Collect and weigh the feed that falls. Divide by the number of birds served by that feeder section and the number of hours observed. Scale to a daily, whole-house estimate.
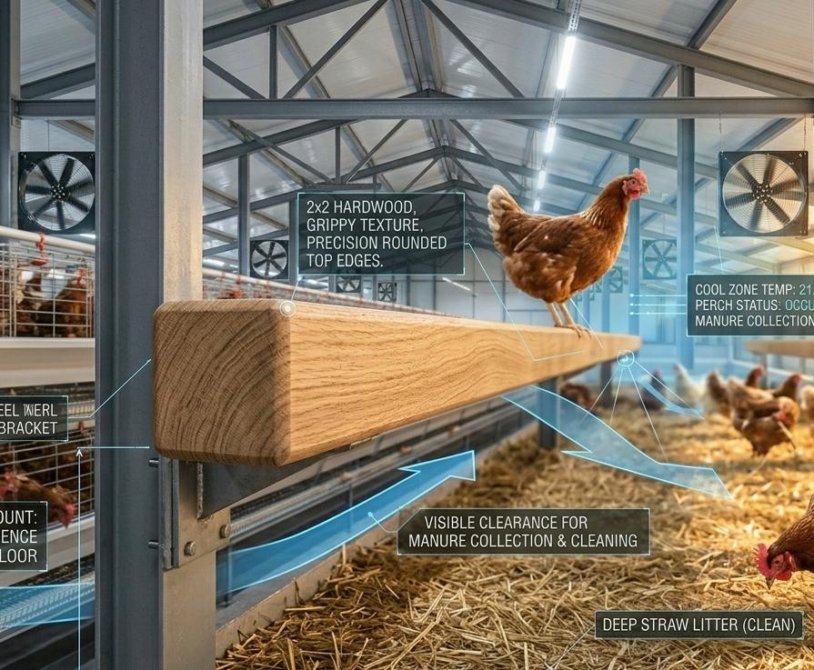
Feeder fill depth management: Chain feeders should be filled to 30–40% of trough depth — enough that all birds can access feed easily, not so much that head movement scatters feed over the edge. Pan feeders should be filled to 50% of the pan’s maximum volume. Automatic feeders that top off continuously are more efficient than manual feeders that are filled to full once or twice daily.
Digital Feed Calculators and Tools
Several digital tools simplify the feed calculation process and add benchmarking capability that paper-based systems cannot easily provide.
Breed supplier spreadsheet tools: Cobb-Vantress, Lohmann, Hy-Line, and ISA all provide downloadable production performance calculators in their breed management documentation. These tools include breed standard values pre-loaded by week of lay, allowing direct comparison of entered actuals against standards. Download the management guide for your specific breed from the supplier’s website — it contains the most accurate breed-standard reference values for FCR, laying rate, egg weight, and feed intake.
Farm management software: Platforms designed for commercial layer management (Agrosoft, Porphyrio, and others with sub-Saharan African deployments) integrate feed tracking, mortality recording, egg production, and financial reporting into a single system that generates FCR calculations automatically from recorded inputs. The investment in farm management software is justified at flock sizes above 10,000 birds, where manual data management becomes error-prone.
Custom spreadsheet: A Google Sheets or Microsoft Excel spreadsheet built around the weekly data template in this article provides full FCR calculation capability with trend charting at zero software cost. Build the formulas once, enter data weekly, and add a chart plotting FCR trend against the breed standard. This is the minimum viable tool for any commercial layer operation, regardless of size.
Summary
FCR is the number that determines whether a layer operation is profitable or merely busy. Every egg produced is a revenue event. Every kilogram of feed consumed is a cost event. The ratio between them — feed consumed per kilogram of egg produced, or per dozen eggs sold — is the clearest single expression of operational efficiency available.
Feed calculators do not improve FCR. They reveal where it is being lost — whether in laying rate, egg weight, ration energy density, feed wastage, or measurement error — so that the correct intervention can be identified and applied. A farmer who calculates FCR but does not decompose it into its component variables knows that performance is poor. A farmer who uses a feed calculator to identify which variable is responsible knows what to fix.
The four variables are measurable. The gaps are closeable. The feed calculator is the tool that makes the difference between knowing your FCR and understanding it.
Run the numbers. Every week. Without exception.