If a commercial pig farm tracked only one performance number, feed conversion ratio (FCR) would be the correct choice. It is the single metric that most directly translates the farm’s largest cost input — feed, at 60–70% of total production cost — into a measure of operational efficiency that can be tracked weekly, compared across pens, benchmarked against breed standards, and used to diagnose problems before they become financial emergencies.
FCR is deceptively simple to define and genuinely difficult to optimize. The calculation — total feed consumed divided by total weight gain — takes seconds to compute. But the number that calculation produces is the downstream output of dozens of interacting variables: genetics, health status, environmental conditions, feed quality, water access, social stress, and management precision, each contributing to or detracting from the pig’s ability to convert feed into lean tissue efficiently.
This guide explains what FCR actually measures and why it matters financially, then works through the complete set of management levers — separate from the genetic selection covered elsewhere in this series — that determine whether a farm consistently achieves industry-standard FCR or operates persistently above it, bleeding feed cost that correct management would have captured as profit.
Part 1: What FCR Actually Measures
The Basic Calculation
FCR = Total feed consumed (kg) ÷ Total live weight gain (kg)
An FCR of 2.6 means 2.6 kg of feed were required to produce 1 kg of live weight gain. Lower is better — it means the pig (or the pen, or the farm) is extracting more growth from each kilogram of feed purchased.
Why FCR Is the Right Metric to Track (And What It Hides)
FCR’s power as a management metric comes from its comprehensiveness — it integrates every factor affecting feed efficiency into a single number, which is exactly what makes it useful for trend tracking and benchmark comparison. A farm whose FCR drifts from 2.6 to 2.9 over several months has experienced a real, financially significant decline in efficiency, even if no single obvious cause (disease outbreak, feed quality problem) is immediately apparent.
What FCR does not tell you on its own: It does not identify why efficiency declined. A worsening FCR could result from disease pressure, heat stress, water access problems, social competition from overcrowding, feed quality issues, or genetics, and distinguishing between these causes requires investigation beyond the FCR number itself. This is precisely why FCR functions best as a trigger for diagnostic investigation rather than a diagnosis in itself.
Industry Benchmark FCR by Production Stage
| Stage | Target FCR | Achievable Range | Poor Performance Threshold |
|---|---|---|---|
| Weanling (7–25 kg) | 1.4–1.7 | 1.3–1.8 | Above 2.0 |
| Grower (25–60 kg) | 2.2–2.5 | 2.0–2.6 | Above 3.0 |
| Finisher (60–110 kg) | 2.7–3.2 | 2.5–3.4 | Above 3.8 |
| Whole life (7–110 kg, cumulative) | 2.4–2.8 | 2.2–2.9 | Above 3.5 |
Why FCR worsens as the pig matures: Younger, lighter pigs partition a higher proportion of consumed energy toward lean tissue growth, which is metabolically cheaper to deposit than fat (approximately 2.5 kcal/g for protein versus 9.5 kcal/g for fat). As pigs mature and approach their genetic mature size, an increasing proportion of energy intake goes toward maintenance (a fixed cost that does not contribute to growth) and toward fat deposition (which becomes proportionally larger as the growth rate of lean tissue slows). This is a normal biological pattern, not a management failure — but it means whole-life FCR figures must be interpreted in the context of the weight range they cover, and stage-specific FCR tracking (rather than relying solely on a single whole-cycle number) is essential for accurate diagnosis of where efficiency problems originate.
Part 2: The Financial Weight of FCR
Converting FCR Points Into Money
At a 1,000-pig annual finisher operation (75 kg average gain per pig, XAF 300/kg feed cost):
Each 0.1 improvement in FCR represents: 1,000 pigs × 75 kg × 0.1 = 7,500 kg feed saved 7,500 kg × XAF 300/kg = XAF 2,250,000 (USD 3,750) per year
The cumulative effect across a realistic improvement range:
| FCR Improvement | Annual Feed Saving (XAF) | Annual Feed Saving (USD) |
|---|---|---|
| 0.1 (2.7 → 2.6) | 2,250,000 | 3,750 |
| 0.2 (2.8 → 2.6) | 4,500,000 | 7,500 |
| 0.3 (2.9 → 2.6) | 6,750,000 | 11,250 |
| 0.5 (3.1 → 2.6) | 11,250,000 | 18,750 |
A farm operating at 3.1 FCR rather than the achievable 2.6 — a gap that is common in operations without disciplined management attention to the factors covered in this guide — is leaving approximately XAF 11,250,000 (USD 18,750) on the table annually at 1,000-pig scale, purely from management-correctable inefficiency, separate from any genetic improvement.
Why FCR Deserves More Attention Than Growth Rate Alone
Many farms track average daily gain (ADG) as their primary performance indicator because faster growth feels intuitively like better performance — pigs reach market weight sooner, pen turnover increases, and the farm appears more productive. But ADG alone can mislead: a pig achieving fast growth through excessive feed intake (eating substantially more than necessary to achieve that growth rate) can show impressive ADG while simultaneously showing poor FCR — meaning the fast growth was purchased at a feed cost that exceeds its value.
The correct framing: ADG determines how quickly pen capacity turns over (a throughput metric). FCR determines how much that growth costs to produce (an efficiency metric). Both matter, but FCR has the more direct and larger impact on profitability per pig, because feed cost dwarfs every other variable cost in the production budget.
Part 3: The Management Levers That Drive FCR (Beyond Genetics)
Genetic selection for FCR, covered in detail elsewhere in this series, establishes the pig’s ceiling — its best possible FCR under ideal conditions. The management levers in this section determine how close to that genetic ceiling the farm’s actual, measured FCR comes. A farm with excellent genetics but poor management on these factors will show worse FCR than a farm with merely adequate genetics and disciplined management.
Lever 1: Health Status and Subclinical Disease
The mechanism: A pig mounting an immune response — even a subclinical one that produces no obvious clinical signs — diverts metabolic resources toward immune function and away from growth. This diversion happens at the cellular level: cytokine signaling associated with immune activation directly suppresses appetite, reduces nutrient absorption efficiency, and redirects amino acids toward acute-phase protein synthesis (immune-related proteins) rather than muscle protein synthesis.
The measurable impact: Research on subclinical disease challenge consistently shows FCR penalties of 5–15% in pigs experiencing ongoing low-level pathogen challenge compared to pigs in a genuinely low-pathogen environment, even when no pig in either group shows overt clinical illness.
The management response:
- Implement and maintain the vaccination schedule appropriate to the farm’s specific disease risk profile (covered in detail in health management articles in this series)
- Maintain biosecurity protocols that minimize ongoing pathogen exposure — visitor restriction, footbaths, isolation of incoming animals
- Practice all-in/all-out management at the building or room level, breaking the continuous pathogen accumulation cycle that occurs in continuously occupied housing
- Monitor for subtle signs of subclinical disease — slightly reduced feed intake across a pen, slightly rougher coat condition, slightly lower activity level — that may not meet the threshold for clinical diagnosis but indicate the immune system is engaged
Lever 2: Thermal Environment
The mechanism: Pigs outside their thermoneutral zone divert energy to thermoregulation. In heat stress (above the thermoneutral zone), pigs reduce voluntary feed intake to reduce the metabolic heat generated by digestion — directly reducing total nutrient intake available for growth, independent of any change in feed quality or formulation. In cold stress (below the thermoneutral zone, less common in West African conditions but relevant in highland areas during harmattan), pigs increase maintenance energy expenditure to maintain body temperature, worsening FCR even if feed intake remains adequate.
The measurable impact: Feed intake declines approximately 1.5–2% per degree Celsius above the upper critical temperature of the thermoneutral zone. At 5°C above the thermoneutral ceiling — not unusual in poorly ventilated West African finisher housing during peak dry-season heat — feed intake reduction of 7.5–10% translates to meaningfully reduced growth rate and, because maintenance energy requirements do not decline proportionally, worsened FCR.
The management response:
- Ensure ventilation design (covered extensively in housing-focused articles in this series) provides adequate airflow to remove metabolic heat and maintain pen temperature within the thermoneutral range for each production stage
- Implement supplemental cooling (drip cooling, increased fan capacity) during peak heat periods, particularly for finisher pigs whose larger body mass generates the most metabolic heat per pen
- Avoid overstocking, which increases the metabolic heat load per unit of pen floor area and compounds thermal stress (covered in space allowance articles in this series)
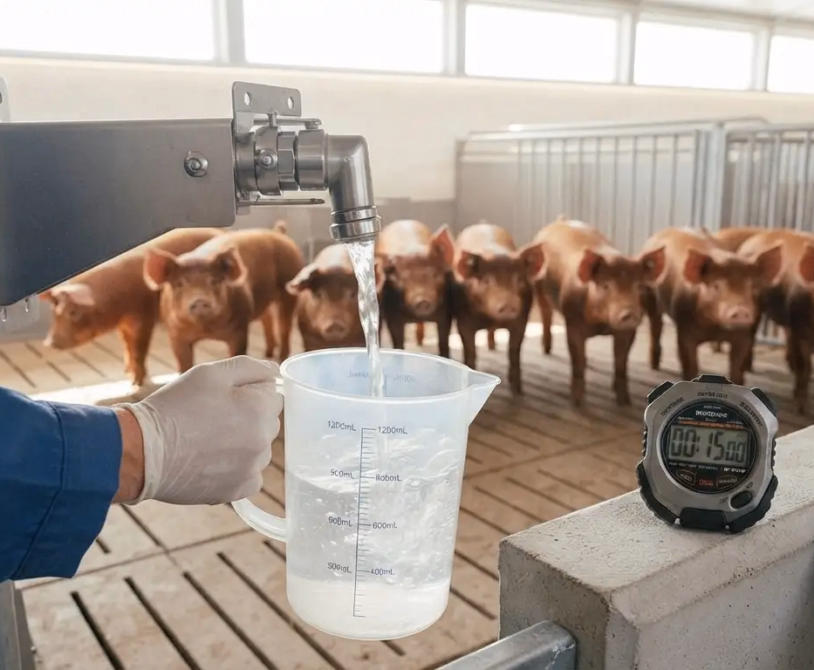
Lever 3: Water Access and Quality
The mechanism: Feed intake and water intake are physiologically linked — pigs regulate their feed intake partly based on water availability, since digestion and nutrient metabolism require adequate water for the physiological processes involved. Restricted water access, whether from inadequate drinker flow rate, insufficient drinker-to-pig ratio, or malfunctioning equipment, directly suppresses feed intake.
The measurable impact: Water restriction beyond 12 hours measurably reduces feed intake within 24 hours, with effects persisting for 3–5 days after water access is restored even after a single restriction event — meaning intermittent water access problems (a drinker that malfunctions periodically rather than continuously) can produce a chronic FCR penalty that is difficult to trace to its cause without deliberate investigation of water system performance.
The management response:
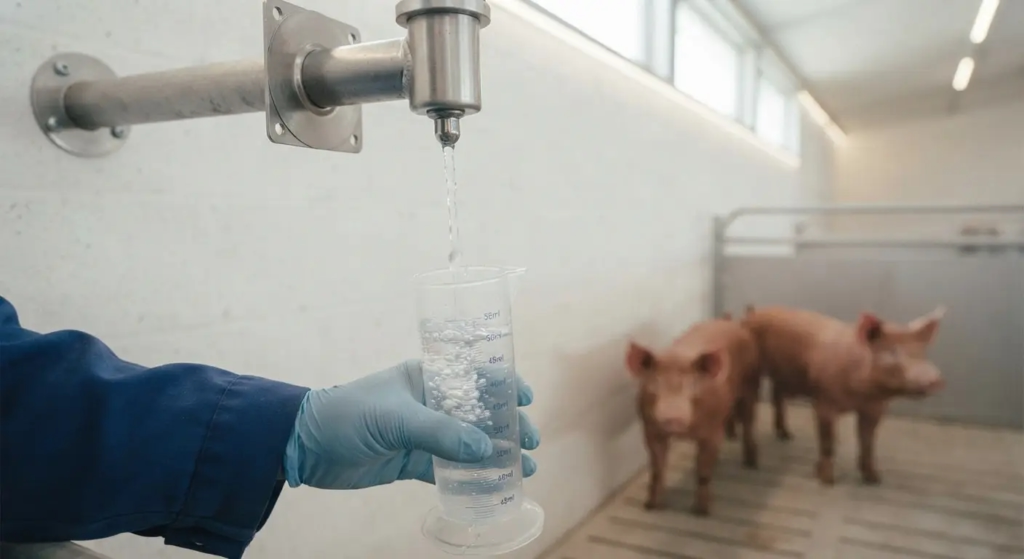
- Implement the weekly nipple drinker inspection protocol detailed in water management articles in this series, verifying correct flow rate and absence of blockage at every drinker position
- Maintain the correct drinker-to-pig ratio (minimum 1:10–12 for grower-finisher pigs) to prevent competition-driven access restriction even when individual drinkers are functioning correctly
- Verify water quality periodically — high mineral content, bacterial contamination, or unpalatable taste from water source issues can reduce voluntary water intake even when drinkers are mechanically functional
Lever 4: Stocking Density and Social Stress
The mechanism: As detailed in space allowance articles in this series, overcrowding increases competition for feeder access, elevates cortisol (the stress hormone), which redirects metabolic resources away from growth, and increases the metabolic heat load per unit of floor area — all of which independently worsen FCR.
The measurable impact: Research consistently shows that each 10% reduction in space allowance below the recommended minimum reduces feed intake by approximately 2–4% and worsens FCR by approximately 2.5–4%, through the combined mechanisms of competition stress and thermal load.
The management response:
- Build and maintain pen stocking at or above the minimum space allowance specifications for each production stage
- Manage group size within the recommended range (8–15 for grower-finisher pigs) — even at adequate per-pig floor area, excessively large groups increase competition and social instability
- Avoid mixing unfamiliar pigs unnecessarily, since each mixing event triggers a period of social hierarchy re-establishment (aggression, stress, reduced feed intake) that temporarily worsens FCR until the new social order stabilizes
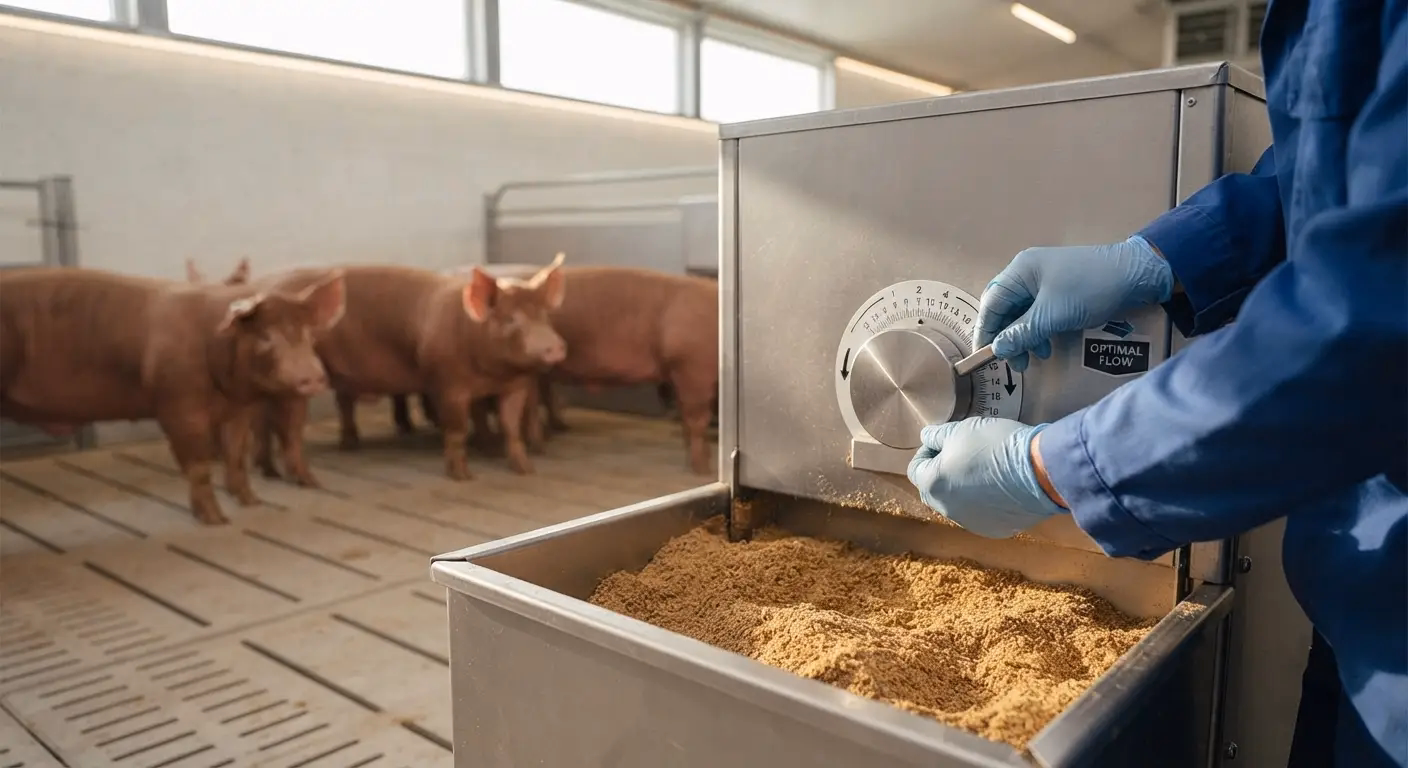
Lever 5: Feed Wastage
The mechanism: FCR calculation requires accurate measurement of feed consumed — feed that is delivered to the pen but spilled, fouled by manure contact, or otherwise wasted without being eaten by the pig inflates the apparent feed consumption without contributing to growth, worsening the calculated FCR even though the pig’s actual biological conversion efficiency may be unchanged.
This is simultaneously a measurement accuracy issue and a genuine economic cost issue — wasted feed is feed cost paid without growth benefit, regardless of whether it’s attributed to “true” FCR or to wastage specifically.
Common sources of feed wastage:
- Feeder design: Feeders without adequate lip height or anti-rooting design allow pigs to push feed out of the trough onto the floor during feeding activity
- Overfilling: Filling feeders beyond the level pigs can access without spillage, particularly relevant for trough-style feeders
- Feed delivery system leaks: Auger or pipe delivery systems with leaks or poor calibration that deliver more feed than the feeder can hold
- Pest losses: Birds, rodents, and insects consuming or contaminating stored or delivered feed
The measurable impact: Feed wastage in poorly managed systems can range from 3–8% of total feed delivered — a substantial proportion of total feed cost that delivers zero growth benefit. Reducing wastage from 6% to 2% at a 1,000-pig operation represents a feed saving comparable to a genuine 0.1–0.15 FCR improvement.
The management response:
- Use feeder designs with adequate lip height (minimum 10–15 cm) and anti-rooting features appropriate to the production stage
- Train staff on correct feeder filling levels — feed should not be visible above the feeder lip in a way that allows pigs to easily displace it
- Regularly inspect feed delivery systems (augers, pipes, drop points) for leaks, blockages, or miscalibration
- Implement pest control measures for feed storage areas (rodent exclusion, bird netting where applicable)
Lever 6: Feed Quality and Storage
The mechanism: Feed that has degraded in storage — through moisture absorption, mold growth, rancidity (particularly in fat-containing ingredients), or nutrient degradation from prolonged storage or poor storage conditions — delivers less usable nutrition per kilogram than fresh, correctly stored feed, even when the formulation specification on paper appears identical.
Mycotoxin contamination deserves particular attention in West African storage conditions, where high humidity and temperature create favorable conditions for mold growth in stored grain and feed ingredients. Subclinical mycotoxin exposure (below the threshold that produces obvious clinical signs) measurably depresses feed intake and growth efficiency, contributing to worsened FCR without an obvious diagnostic signal beyond the FCR decline itself.
The management response:
- Store feed in dry, well-ventilated conditions with moisture content maintained below 14% to prevent mold growth
- Implement first-in-first-out inventory management to minimize the duration any batch of feed spends in storage
- Periodically assess stored feed and raw ingredients visually and by smell for signs of spoilage (musty odor, visible mold, caking from moisture)
- Where economically accessible, use mycotoxin binder supplementation in rations, particularly during high-humidity periods or when ingredient sourcing history raises contamination concern
Lever 7: Parasite Burden
The mechanism: Internal parasites (particularly Ascaris suum, the large roundworm, and various coccidia species) compete directly with the pig for nutrients, damage intestinal tissue (reducing absorptive surface area and efficiency), and in the case of Ascaris larval migration, cause liver damage (“milk spot liver” condemnation at slaughter) that further compromises metabolic function.
The measurable impact: Subclinical parasite burdens — below the threshold that produces obvious diarrhea or visible poor condition — are documented to reduce FCR by 5–10% in affected pigs, representing a frequently underdiagnosed cause of persistent farm-wide FCR underperformance, particularly in deep litter and outdoor production systems where parasite life cycles are more readily sustained in the environment.
The management response:
- Implement a structured deworming protocol (typically targeting Ascaris and other common internal parasites) at appropriate intervals for the production system in use
- For deep litter systems specifically, maintain the litter management discipline (moisture control, turning, adequate carbon material) that suppresses parasite egg and larval survival, in addition to anthelmintic treatment
- Periodically assess parasite burden through fecal egg counts, where laboratory access permits, to verify deworming program effectiveness rather than assuming a fixed schedule is adequately controlling the parasite challenge
Lever 8: Diet Transition Management
The mechanism: Each phase feed transition (discussed in detail in feed formulation articles in this series) represents a change in the pig’s gut microbiome’s adapted substrate and, particularly at the weaning transition, a change in the entire digestive physiology (from milk-based to solid feed digestion). Abrupt transitions, particularly without a gradual blending period between the old and new ration, can produce a temporary digestive disruption (reduced intake, occasionally diarrhea) that depresses growth and worsens FCR during the transition period.
The management response:
- Implement gradual ration transitions where feasible — blending decreasing proportions of the previous phase ration with increasing proportions of the new phase ration over 3–5 days, rather than an abrupt complete changeover
- Pay particular attention to the weaning transition, specifically, where the combined stress of maternal separation, new pen-mates, and the shift from milk to solid feed digestion creates the highest-risk transition point in the pig’s life for digestive disruption
Part 4: Diagnosing FCR Problems — A Systematic Approach
When farm or pen-level FCR shows unexpected deterioration, a systematic diagnostic sequence is more effective than guessing at the cause:
Step 1: Verify Measurement Accuracy First
Before investigating biological causes, confirm the FCR calculation itself is accurate:
- Was feed delivery to the pen accurately weighed, not estimated?
- Was feed wastage accounted for or excluded from the “consumed” figure?
- Were pig weights measured accurately and consistently (same time of day, calibrated scale, adequate sample size)?
- Was the weight range/time period boundary clearly and consistently defined?
A significant proportion of apparent FCR “problems” are actually measurement errors rather than genuine biological efficiency changes — ruling this out first prevents wasted investigation effort chasing a phantom problem.
Step 2: Compare Against Historical and Contemporary Benchmarks
- Is the FCR decline specific to one pen/batch, or farm-wide? (Farm-wide suggests feed quality, water supply, or systemic management issue; pen-specific suggests localized housing, health, or stocking issue)
- Is the decline gradual (suggesting an accumulating issue like parasite burden or gradual feed quality decline) or sudden (suggesting an acute event like disease outbreak, equipment failure, or feed batch quality problem)?
- Does the timing correlate with any known event — recent weather change, new feed batch delivery, recent pig movement or mixing, recent vaccination or treatment event?
Step 3: Apply the Lever Checklist Systematically
Work through Levers 1–8 above as a diagnostic checklist:
- Health: Any recent illness, treatment events, or subtle signs of subclinical disease in affected pens?
- Thermal: Has ambient temperature or ventilation performance changed? Check actual pen temperature logs if available, not just outdoor weather assumptions
- Water: Inspect every drinker in affected pens for flow rate and function
- Stocking: Has group size or space allowance changed? Any recent mixing events?
- Wastage: Inspect feeders for spillage evidence; check feed delivery system calibration
- Feed quality: Inspect current feed batch for storage condition, odor, visible spoilage; review storage duration and conditions
- Parasites: Review deworming schedule timing and compliance; consider fecal egg count testing if available
- Transitions: Has a recent phase feed change occurred? Was it gradual or abrupt?
Step 4: Implement Corrective Action and Monitor
Once a probable cause (or combination of causes) is identified, implement the corresponding management response and continue FCR monitoring closely over the following weeks to confirm the correction produces measurable improvement — validating the diagnosis rather than assuming the identified cause was correct without confirming the intervention worked.
Part 5: Building an FCR Monitoring System
Minimum Viable Tracking
Even operations without sophisticated record-keeping infrastructure should track, at a minimum:
- Feed delivered to each pen (weighed by date)
- Pig count and weight at the start and end of each defined measurement period per pen
- Calculated FCR per pen per phase
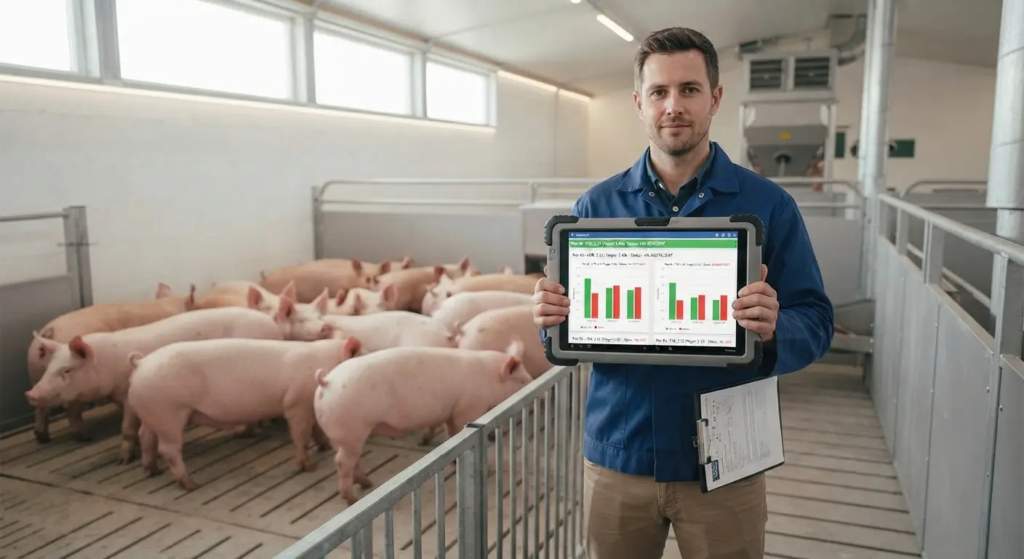
The Value of Pen-Level (Not Just Farm-Level) Tracking
Farm-wide average FCR can mask significant pen-to-pen variation — a farm averaging 2.7 FCR might actually have some pens performing at 2.5 and others at 3.0, with the average obscuring the specific pens (and their specific underlying causes) that are dragging overall performance down. Pen-level tracking, even if more labor-intensive to maintain, provides the diagnostic resolution needed to identify and correct specific problems rather than treating the whole farm uniformly when the issue may be localized.
Benchmarking Against Targets
Compare measured FCR against the breed/genetics-specific target (available from the genetics supplier, or from the stage-specific benchmarks in Part 1 of this guide) rather than only against the farm’s own historical performance. A farm that has always operated at 3.0 FCR and considers that “normal” is missing the gap between its actual performance and its achievable performance — historical comparison alone can mask chronic underperformance that has simply never been benchmarked against what the genetics in the herd are actually capable of achieving under correct management.
Summary
FCR is the financial pulse of a pig operation — the single number that most directly reflects whether the farm’s largest cost input (feed) is being converted into its primary product (pig growth) efficiently. Genetics establishes the ceiling for what FCR is achievable; management determines how close the farm’s actual, measured performance comes to that ceiling.
The eight management levers in this guide — health status, thermal environment, water access, stocking density, feed wastage, feed quality and storage, parasite burden, and diet transition management — operate independently of genetics and are entirely within the farm’s direct control. A farm that systematically manages all eight levers will achieve FCR performance close to its genetic potential. A farm that neglects even two or three of them will show measurable, financially significant FCR deterioration regardless of how good the underlying genetics are.
At a 1,000-pig scale, the gap between disciplined management (FCR 2.6) and neglected management (FCR 3.1) represents approximately XAF 11,250,000 (USD 18,750) in annual feed cost — money available to any operation willing to apply the systematic diagnostic and corrective discipline this guide describes, without requiring any genetic improvement, capital investment in new infrastructure, or change in breed.
Track it weekly. Diagnose deviations systematically. Correct the identified cause. FCR will tell you, with financial precision, whether the correction worked.