Dissolved oxygen gets the most management attention in catfish farming because its consequences are fastest — an oxygen crash kills in hours and is impossible to miss. The four parameters covered in this guide operate on longer timescales: pH changes over days, ammonia accumulates over days to weeks, nitrite builds up over similar periods, and temperature shifts follow seasonal and diurnal patterns. Their slower timescales make them easier to miss — and their production consequences, while less dramatic than an acute oxygen crisis, are financially equally significant when they operate outside acceptable ranges for extended periods.
A catfish farm with chronically elevated ammonia does not experience a dramatic mortality event that galvanizes management response. It experiences progressively worsening FCR, slower growth, increased disease incidence, and elevated background mortality — all of which are attributable to “management problems” without the specific diagnostic that water quality measurement would provide. The farm manager who measures these parameters weekly catches the drift early and corrects it with modest intervention. The farm manager who measures them rarely discovers the problem only after its financial consequences have accumulated through several production cycles.
This guide provides the biological rationale for each parameter’s management range, the measurement and monitoring discipline that detects problems early, the causes that drive each parameter out of range, and the specific corrective interventions appropriate for each parameter in the West and Central African commercial catfish production context.
pH — The Foundation of Water Chemistry
What pH Is and Why It Matters in Catfish Production
pH measures the concentration of hydrogen ions (H⁺) in water on a logarithmic scale from 0 (extremely acidic) to 14 (extremely alkaline), with 7 representing neutral. The logarithmic nature means that each unit change represents a tenfold change in hydrogen ion concentration — pH 6 is ten times more acidic than pH 7, and pH 5 is one hundred times more acidic than pH 7.
pH matters in catfish production through two primary mechanisms:
Direct physiological effects on fish: The gill is the primary interface between the fish’s internal body fluids and the external water environment. The fish must maintain its blood pH at approximately 7.4–7.8 regardless of external water pH — doing this against extreme external pH requires energy expenditure that reduces energy available for growth. More critically, extreme low pH (below 5.0) causes direct gill tissue damage and failure of ion regulatory mechanisms; extreme high pH (above 9.5) causes the gill tissue burns from hydroxide ions and severe ammonia toxicity intensification.
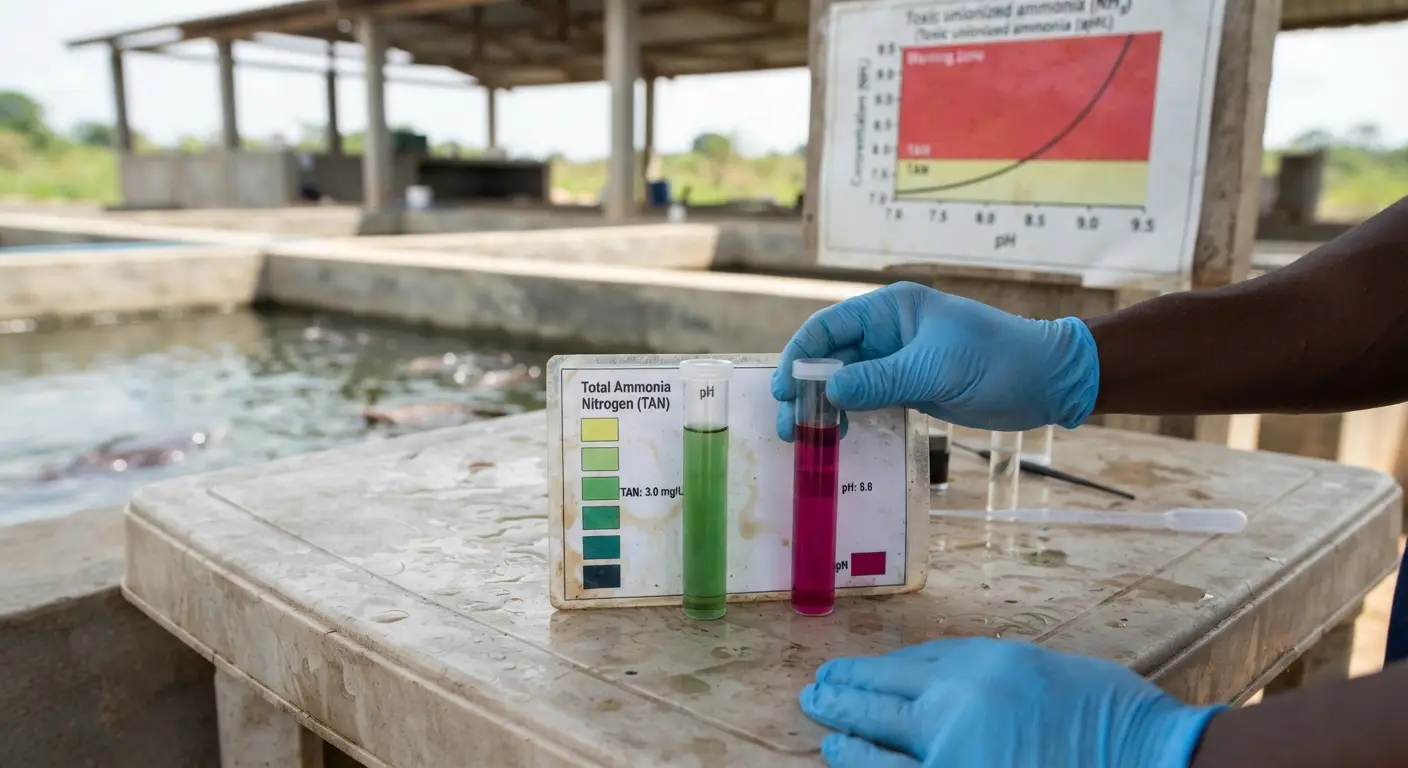
Indirect effects through chemistry: pH controls the chemical speciation of other water quality parameters — most importantly ammonia, where pH determines what proportion of total ammonia exists in the toxic unionized form (NH₃) vs. the less toxic ionized form (NH₄⁺). As pH increases, the proportion of toxic NH₃ increases dramatically even if total ammonia concentration remains constant. This interaction makes pH and ammonia management inseparable — covered in detail in Part 2.
pH Targets and Tolerance Ranges for African Catfish
| pH Range | Status | Fish Response |
|---|---|---|
| Below 5.0 | Lethal | Gill damage, ion regulation failure, death |
| 5.0–6.0 | Severely stressful | Reduced growth, elevated disease susceptibility, chronic health compromise |
| 6.0–6.5 | Suboptimal | Moderately reduced growth; acceptable short-term but not for extended production |
| 6.5–8.5 | Optimal range | Full growth potential, normal physiology, optimal feed conversion |
| 8.5–9.0 | Marginal | Reduced growth; increasing ammonia toxicity if any ammonia is present |
| 9.0–9.5 | Stressful | Significant growth suppression; ammonia toxicity intensification; disease susceptibility |
| Above 9.5 | Lethal at sustained exposure | Gill burns, ammonia toxicity cascade, death |
The pH Dynamics in Earthen Pond Systems
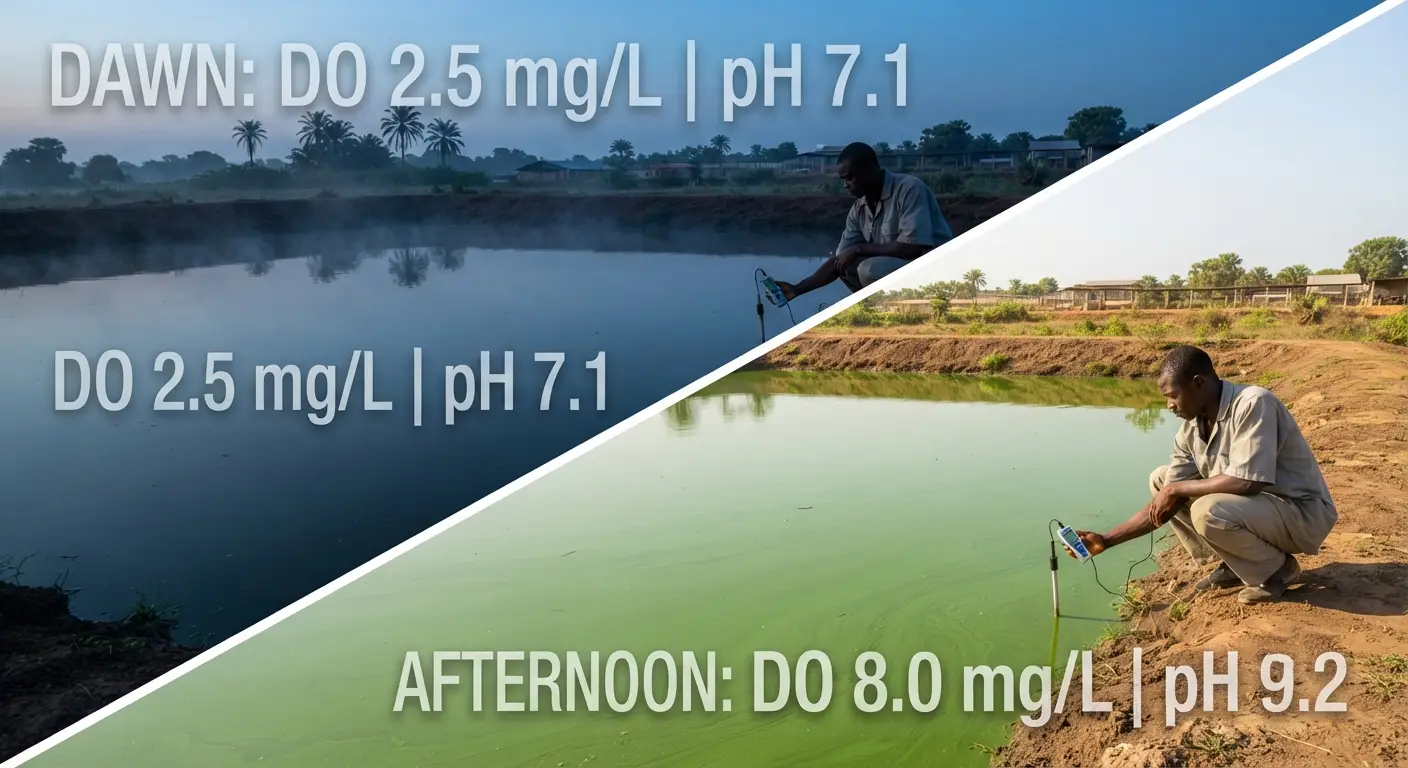
The diurnal pH cycle: Like dissolved oxygen, pH in earthen ponds follows a diurnal cycle driven by photosynthesis and respiration. During the day, photosynthesis consumes CO₂ from the water, reducing carbonic acid concentration and driving pH upward. At night, respiration adds CO₂ to the water (which dissolves as carbonic acid), reducing pH toward the pre-dawn minimum.
In productive ponds with dense phytoplankton blooms, this diurnal pH swing can be 1.5–2.0 pH units — from a pre-dawn low of 7.0–7.5 to an afternoon high of 8.5–9.5 in extreme cases. While the individual extremes may be within the tolerable range, the constant cycling itself is a physiological stressor, and afternoon peaks above 9.0 in dense algal blooms represent a genuine production impact.
Measuring pH in ponds: Because of the diurnal cycle, a single pH measurement has limited management value unless it is taken at a consistent time. Measure pH at the same time each day for meaningful trend comparison — the pre-dawn measurement captures the minimum (most acidic, relevant for assessing acid stress risk) and the early afternoon measurement captures the maximum (relevant for assessing alkaline and ammonia toxicity risk).
pH and pond alkalinity: The magnitude of the diurnal pH swing is moderated by the pond water’s alkalinity (its buffering capacity against pH change). Water with high alkalinity (above 100 mg/L as CaCO₃) resists pH change — the same amount of CO₂ addition or removal produces a smaller pH shift than in low-alkalinity water. Low-alkalinity water (below 20 mg/L as CaCO₃) shows extreme pH swings in response to photosynthesis and respiration and is inherently unstable as a production environment.
Causes of Low pH and Correction
Cause 1: Acidic source water
Borehole water from areas with acidic soils (common in parts of West and Central Africa with lateritic soils) can have pH 5.5–6.5. The pond or tank water pH will eventually approach the source water pH if adequate buffering is not provided.
Correction: Agricultural lime (calcium carbonate, CaCO₃) or quicklime (calcium oxide, CaO) added to the pond water increases pH and increases alkalinity simultaneously. Liming rates depend on current pH and alkalinity — laboratory water analysis guides the specific application rate. General guidance: 200–500 kg of agricultural lime per hectare of pond surface, mixed with water and broadcast evenly, raises pH by approximately 0.5–1.0 pH units in low-alkalinity ponds.
Cause 2: Acid-forming bottom sediment
Acidic organic sediment in earthen ponds — accumulated from decomposing feed waste, manure, and plant material — can release acid compounds into the water column, progressively acidifying the pond. This is most common in older, heavily loaded ponds that have not been cleaned in several years.
Correction: Annual liming of pond bottom sediment during the dry period when ponds are drained and dried (200–400 kg lime per 1,000 m² applied to the dry sediment surface and incorporated by raking) neutralizes accumulated acid and prepares the pond base for the next production cycle.
Cause 3: Rainwater input
Rainwater (pH approximately 5.5–6.0 in clean atmospheric conditions, potentially lower in areas with air pollution) can significantly acidify a pond during heavy rainfall events if the pond has low buffering capacity.
Correction: Maintain adequate pond alkalinity (above 80 mg/L as CaCO₃) through regular liming — well-buffered water resists the pH drop from rainwater addition that unbuffered water cannot resist.
Causes of High pH and Correction
Cause: Dense algal bloom photosynthesis
The most common cause of dangerously high pH in earthen ponds — dense phytoplankton blooms driving afternoon pH to 9.0–9.5 or above through CO₂ depletion.
Correction:
- Water exchange: replacing a portion of the high-pH pond water with lower-pH source water dilutes the photosynthetic product
- Increasing aeration: surface aeration increases CO₂ stripping in the short term but also increases DO production from photosynthesis — partial benefit
- Algal bloom management: reducing nutrients in the pond (through reduced feed rates and nutrient loading) limits algal density and moderates the photosynthetic pH drive
- CO₂ injection: adding CO₂ gas to water acidifies it rapidly — appropriate for RAS and concrete tank systems but expensive for large pond volumes
Ammonia — The Primary Metabolic Toxin
Ammonia Chemistry and Toxicity
Ammonia (NH₃) is the primary nitrogen waste product of protein catabolism in fish — protein consumed in feed is broken down during digestion, and the nitrogen component that is not incorporated into fish tissue is excreted as ammonia primarily through the gills (with a smaller fraction as urea in urine). In commercial catfish production with high-protein feeds (35–45% crude protein), ammonia excretion is substantial — a tank holding 500 kg of African catfish at 28°C excretes approximately 350–500 g of nitrogen per day as ammonia.
The two chemical forms of ammonia:
Total ammonia nitrogen (TAN) in water exists as two interconverting chemical forms:
- Ionized ammonium (NH₄⁺): The protonated form, relatively non-toxic at typical production concentrations — it cannot readily cross cell membranes
- Unionized ammonia (NH₃): The uncharged form, highly toxic — it crosses biological membranes freely and disrupts enzyme function, nervous system signaling, and gill ion exchange
The ratio of NH₃ to NH₄⁺ at any given TAN concentration is determined by pH and temperature: as pH increases, more of the total ammonia shifts to the toxic NH₃ form; as temperature increases, the proportion of NH₃ also increases.
The pH-ammonia interaction — why they cannot be managed separately:
At pH 7.0 and 28°C, approximately 0.4% of TAN exists as toxic NH₃ — at a TAN of 1.0 mg/L, the NH₃ concentration is 0.004 mg/L. At pH 8.0 and 28°C, approximately 4.0% of TAN exists as toxic NH₃ — at the same TAN of 1.0 mg/L, the NH₃ concentration is 0.04 mg/L (ten times higher). At pH 9.0 and 28°C, approximately 30% of TAN exists as NH₃ — the same TAN of 1.0 mg/L produces NH₃ of 0.30 mg/L (seventy-five times higher than at pH 7.0).
This calculation is the single most important water chemistry interaction to understand in catfish production. A TAN level that is safe at pH 7.5 becomes highly toxic at pH 8.5 — and ponds with dense algal blooms routinely reach pH 8.5–9.0 in the afternoon, creating acute ammonia toxicity events from TAN levels that would be safe at lower pH.
Ammonia Toxicity Thresholds for African Catfish
| Unionized NH₃ (mg/L) | Effect |
|---|---|
| Below 0.02 | Safe — no measurable effect on growth or health |
| 0.02–0.05 | Chronic sublethal stress — reduced growth rate, increased disease susceptibility over time |
| 0.05–0.10 | Significant chronic stress — measurable growth suppression, gill hyperplasia begins |
| 0.10–0.30 | Acute sublethal — significant mortality of vulnerable fish, severe gill damage |
| Above 0.30 | Acute lethal — mass mortality expected |
The practical management target: Keep unionized NH₃ below 0.02 mg/L at all times. Calculate this from total TAN measurement × the NH₃ fraction appropriate for current pH and temperature (use published conversion tables or online calculators).
Measuring Ammonia
Test kits (colorimetric): The most accessible measurement method for farm-side testing — a water sample is mixed with reagents and the resulting color compared to a reference chart to estimate TAN. Available from aquaculture and water testing suppliers; sufficient precision for routine monitoring.
Electronic ammonia meters: Provide more precise TAN readings than colorimetric kits but require calibration and more expensive probes. Useful for operations where frequent precise measurement justifies the investment.
Laboratory analysis: Full water chemistry laboratory panels (including TAN with precision) are appropriate for diagnostic investigation of persistent water quality problems or for initial baseline assessment of a new farm’s water characteristics.
Causes of Elevated Ammonia and Correction
Cause 1: Overstocking relative to water exchange capacity
The most common cause in concrete tank systems — fish biomass has grown beyond what the water exchange rate can dilute adequately.
Correction: Increase water exchange rate (if supply capacity allows), harvest fish to reduce biomass, or install biological filtration (biofilter) to convert TAN to less toxic nitrate without requiring large water exchange volumes.
Cause 2: Overfeeding and uneaten feed accumulation
Uneaten feed decomposes and releases ammonia — contributing to TAN load above and beyond the fish’s direct excretion.
Correction: Reduce feed rate to what fish actually consume in 20–30 minutes; implement regular tank cleaning to remove accumulated organic material; adjust feed rate immediately when consumption drops.
Cause 3: Poor water exchange management
In systems designed for water exchange, reduced exchange rates (from pump failure, supply shortage, operator error) allow TAN to accumulate toward toxic levels.
Correction: Restore exchange rate; perform emergency large water exchange (50–70% of tank volume if TAN is in the acute stress range); monitor TAN daily until stable.
Cause 4: High pH intensifying toxicity of existing TAN
TAN may not be elevated in absolute terms, but pH elevation (from algal photosynthesis in ponds) is converting a larger fraction to toxic NH₃.
Correction: Address the pH elevation (water exchange, algal management) — reducing TAN alone is not sufficient if pH remains high.
Nitrite — The Brown Blood Disease Risk
Nitrite Chemistry and Mechanism of Toxicity
Nitrite (NO₂⁻) is the intermediate product in the biological oxidation of ammonia to nitrate — produced by the first step of nitrification (conversion by Nitrosomonas bacteria of NH₃ to NO₂⁻). In water systems with inadequate biological filtration or water exchange, nitrite accumulates to toxic concentrations.
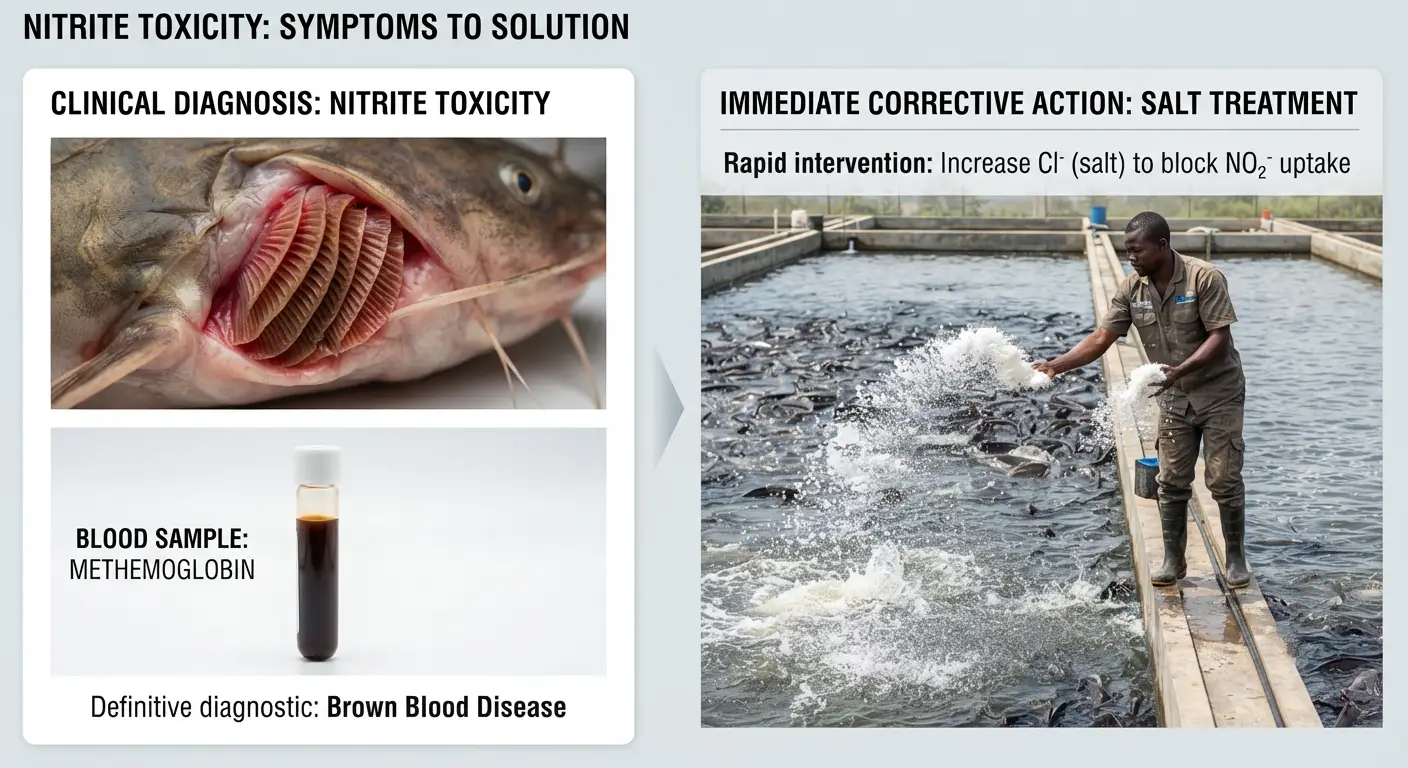
How nitrite causes harm: Nitrite is actively transported across gill epithelium into the blood by the same transport mechanisms that normally move chloride ions (NO₂⁻ and Cl⁻ have similar ionic radii and the transporter cannot discriminate between them). Once in the blood, nitrite oxidizes hemoglobin from its normal reduced form (hemoglobin, capable of binding oxygen) to methemoglobin (incapable of binding oxygen). The result is reduced blood oxygen-carrying capacity — the characteristic “brown blood disease” where blood appears brown rather than red due to methemoglobin accumulation.
Clinical signs of nitrite toxicity:
- Lethargic behavior, reduced responsiveness
- Increased surface breathing (compensating for reduced blood oxygen-carrying capacity despite adequate water DO)
- Gills appearing pale or brownish rather than bright red
- Blood visibly brown rather than red if a sample is taken
- Reduced feed intake
- In severe cases: loss of equilibrium, listing, mass mortality
Nitrite Thresholds for African Catfish
| Nitrite (mg/L as NO₂-N) | Status |
|---|---|
| Below 0.1 | Safe |
| 0.1–0.3 | Suboptimal — some growth suppression |
| 0.3–1.0 | Stress — measurable impact on health and growth |
| 1.0–5.0 | Acute stress — significant mortality risk |
| Above 5.0 | Acute lethal — mass mortality expected |
The chloride mitigation of nitrite toxicity: The gill’s chloride transport mechanism that also transports nitrite can be competitively inhibited by high chloride concentration — if chloride ions are abundant, they out-compete nitrite for the transporter, reducing nitrite uptake into the blood. This forms the basis of the emergency nitrite treatment using common salt (sodium chloride, NaCl):
Emergency salt treatment for acute nitrite toxicity:
- Target chloride: nitrite ratio of minimum 20:1 (by weight) in the water
- At nitrite of 1.0 mg/L: target chloride of 20 mg/L minimum
- Addition of 30–50 mg/L NaCl (approximately 30–50 g per 1,000 liters = 30–50 kg per 1,000 m³) provides adequate chloride protection
This treatment addresses the toxicity mechanism without reducing the nitrite concentration — water exchange is still required to actually remove nitrite from the system.
Causes of Elevated Nitrite and Correction
Cause 1: Accumulation in systems without biological filtration
In flow-through concrete tank systems without biofilters, nitrite produced from ammonia oxidation accumulates if water exchange is insufficient to dilute it.
Correction: Increase water exchange rate; implement a biofilter to complete nitrification (NO₂ → NO₃); emergency salt treatment for acute events.
Cause 2: Incomplete biofilter establishment (new RAS systems)
New RAS systems have no established nitrifying bacterial colony. During the first 4–6 weeks of operation (“cycling the system”), ammonia added by fish is converted to nitrite by Nitrosomonas faster than Nitrobacter can convert nitrite to nitrate — creating a nitrite spike that can be highly toxic.
Correction: The standard approach is to cycle the biofilter before stocking fish (using ammonia solution to establish the bacterial colony), or to stock at very low density and gradually increase biomass as the biofilter capacity develops. Never stock a new RAS at full designed density before the biofilter is established.
Cause 3: Biofilter crash in established RAS
Events that kill the nitrifying bacteria in an established biofilter — antibiotic treatment that reaches the biofilter, sudden pH drop below 6.0, chlorine in supply water, extended power failure stopping water flow through the biofilter — cause nitrite to spike as the biological conversion pathway is disrupted.
Correction: Identify and remove the cause of biofilter disruption; restart the cycling process for the biofilter; maintain fish at reduced density or in external aerated holding until biofilter recovers (typically 2–4 weeks); emergency salt treatment to protect fish during recovery period.
Temperature — The Master Variable
Why Temperature Is the “Master Variable”
Temperature does not act on catfish production in isolation — it modulates the effect of every other parameter and every biological process in the production system simultaneously:
- Higher temperature → higher oxygen demand → smaller DO safety margin
- Higher temperature → higher ammonia excretion rate → faster TAN accumulation
- Higher temperature → more NH₃ from same TAN (direct chemistry) → higher effective toxicity
- Higher temperature → faster pathogen growth rate → increased disease challenge
- Higher temperature → higher fish metabolic rate → more feed needed per unit time for equivalent growth
- Lower temperature → feeding stops → growth stops → immune function declines → disease risk increases
Understanding this cascade explains why temperature management is not just about fish comfort — it is about managing the entire interconnected system of biological and chemical processes that determine production outcome.
Temperature Requirements for African Catfish
| Temperature Range | Growth Status | Management Implication |
|---|---|---|
| Below 14°C | Feeding stops; death risk with prolonged exposure | Emergency heating or fish cannot be held |
| 14–18°C | Minimal feeding; very slow growth | Avoid this range during production; short-term transit tolerable |
| 18–22°C | Reduced but functional feeding; slow growth | Acceptable short-term; adjust feed rate down accordingly |
| 22–26°C | Moderate growth; reasonable feed conversion | Functional production conditions |
| 26–30°C | Optimal — maximum growth rate and feed conversion | Target temperature range for production |
| 30–32°C | Slightly below optimal — still good growth | Acceptable but monitor other parameters closely |
| 32–35°C | Elevated stress; reduced feed intake; increased disease susceptibility | Manage other parameters tightly; provide shade |
| Above 35°C | Acute heat stress; mortality risk | Emergency cooling or water exchange required |
Temperature Monitoring
Frequency: Temperature should be measured at minimum twice daily — morning (coolest part of the day) and afternoon (warmest part of the day). In concrete tanks, temperature variation between morning and afternoon is typically 2–4°C in uncovered tanks exposed to direct sunlight; in covered tanks or shaded ponds, variation is smaller. In earthen ponds, temperature variation is moderated by the large water volume — surface temperatures vary more than deep water temperatures.
Thermometers: Standard glass thermometers (accurate to ±0.5°C) are adequate for farm monitoring. Waterproof digital thermometers provide faster readings and are preferable for use in wet environments. Most DO meters also measure temperature simultaneously, making a separate thermometer redundant when a DO meter is in use.
Managing Temperature Extremes
Managing high temperature (above 32°C):
Shade structure: Covering concrete tanks with shade cloth (50–70% shade density) significantly reduces the solar heat load that elevates tank water temperature — shade structures can reduce tank water temperature by 3–5°C compared to unshaded tanks during peak afternoon temperatures.
Increase water exchange: Adding cooler supply water (borehole water at groundwater temperature is typically 24–27°C, cooler than peak afternoon pond or tank temperature) dilutes hot surface water and brings down average tank temperature.
Reduce stocking density: High fish density generates metabolic heat that contributes to water temperature in tanks — reducing stocking density during the hottest periods reduces both the temperature impact and the oxygen demand pressure that compounds heat stress.
Reduce feeding rate during peak heat: Feed at the coolest parts of the day (early morning, evening) when temperature is closer to the optimal range; reduce or suspend midday feeding during peak temperature periods.
Managing low temperature (below 22°C):
In West African coastal and highland areas where temperatures drop during the harmattan season (December–February in Nigeria, November–February in Cameroon), water temperatures in open tanks and ponds can fall into the growth-limiting range.
Greenhouse structures: Enclosing concrete tank operations in greenhouse-type structures (clear plastic sheeting over a simple frame) significantly raises enclosed air temperature and correspondingly raises water temperature by 4–8°C compared to the external ambient.
Reduce stocking density and feed rate: At temperatures below 22°C, feeding rate should be reduced proportionally — fish are digesting more slowly and overfeeding at lower temperatures increases uneaten feed accumulation and the consequent ammonia and oxygen impacts.
Move production schedule: Where harmattan temperature drops are predictable and severe, production scheduling that targets harvest before the lowest-temperature months (and avoids stocking during those months) reduces the growth rate impact.
Integrated Water Quality Monitoring — The Complete Protocol
Why Parameters Must Be Monitored Together
The individual parameter thresholds described in this article and the dissolved oxygen article are meaningful only when parameters are assessed together — because the interaction effects between parameters create conditions that individual-parameter thresholds do not capture.
The ammonia-pH crisis scenario:
A pond with TAN of 0.8 mg/L (below most “action” thresholds when read in isolation) and pH of 9.0 (from afternoon photosynthesis in a dense algal bloom) has NH₃ of approximately 0.24 mg/L — in the acute lethal range, despite neither individual parameter appearing dramatically out of range in isolation.
The temperature-DO crisis scenario:
A tank with DO of 5.5 mg/L (within the “acceptable” range in the table) at 32°C contains fish with oxygen consumption rate approximately 50% higher than at 26°C — the same 5.5 mg/L DO at 32°C represents a proportionally smaller safety margin than at 26°C, because the fish are consuming it much faster. The “adequate” DO reading at high temperature does not represent the same physiological adequacy as the same reading at lower temperature.
Recommended Monitoring Schedule
| Parameter | Minimum Frequency | Method | Action Threshold |
|---|---|---|---|
| Dissolved oxygen | Twice daily (dawn + afternoon in ponds; morning + evening in tanks) | DO meter | Below 5 mg/L: act |
| Temperature | Twice daily (morning + afternoon) | Thermometer or DO meter | Above 32°C or below 18°C: act |
| pH | Daily (pre-dawn minimum + afternoon maximum in ponds) | pH meter or test kit | Below 6.5 or above 8.5: investigate |
| Total ammonia nitrogen (TAN) | Weekly (or immediately if NH₃ calculated above 0.02 mg/L) | Test kit or meter | TAN > 1.0 mg/L at pH 7.5: act |
| Unionized NH₃ | Calculate from TAN + pH + temperature whenever TAN is measured | Conversion table | Above 0.02 mg/L: act |
| Nitrite (NO₂-N) | Weekly in flow-through systems; twice weekly in RAS | Test kit or meter | Above 0.3 mg/L: act |
| Alkalinity | Monthly | Test kit | Below 50 mg/L CaCO₃: lime |
| Turbidity (Secchi depth in ponds) | Weekly | Secchi disk | Below 25 cm: dense bloom risk; above 60 cm: low productivity |
The Water Quality Record
Every measurement should be recorded in the farm’s water quality log — date, time, parameter measured, result, and any action taken. This record serves three functions:
Trend detection: A single measurement out of range might be measurement error or a transient event. A consistent trend across multiple measurements confirms a genuine management problem requiring investigation. The trend is only visible if measurements are consistently recorded.
Diagnostic support: When disease or production performance problems occur, the water quality record from the preceding weeks provides the diagnostic context — whether the problem coincides with a water quality exceedance or occurred despite good water quality, guiding the investigation toward or away from water quality as a contributing factor.
Management verification: Records confirm that the monitoring protocol is being followed consistently — that morning pH measurements are actually being taken at dawn rather than at midday when they are more convenient, and that the results are genuine rather than estimated.
Summary
pH, ammonia, nitrite, and temperature are not independent parameters to be managed in isolation — they form an interacting system where each affects the risk profile created by the others. High pH intensifies ammonia toxicity. High temperature amplifies oxygen demand and disease risk while narrowing the safety margins for every other parameter. Nitrite accumulates when the biological conversion pathway is disrupted — and its toxicity is modulated by the chloride concentration that determines gill uptake competition.
Effective management of this interconnected system requires monitoring all four parameters on a consistent schedule, calculating the interaction effects (particularly NH₃ from TAN × pH × temperature) rather than assessing each parameter in isolation, and maintaining the records that allow trend detection before individual measurements have escalated to production-impacting levels.
The farm that monitors water quality comprehensively and responds to early warning indicators consistently will spend modest amounts of effort on preventive intervention. The farm that monitors infrequently and responds only to visible production impacts will spend much larger amounts in mortality losses, antibiotic treatments, poor FCR, and slow growth — all of which are water quality management consequences that are visible only in hindsight, from the financial records of a production cycle that has already underperformed.
The next article in this series covers the filtration and recirculation technology that removes the constraint of continuous water exchange by treating and recycling water within the production system.