The previous article in this cluster established why routine measurement and record-keeping is the foundation of evidence-based catfish farm management. This article addresses the tools that make that record-keeping more efficient, more consistent, and more analytically powerful — converting raw field measurements into the calculated metrics and visual trend indicators that support the management decisions the data was collected to inform.
The spectrum of digital tools available to commercial catfish farms in West and Central Africa ranges from basic mobile calculator apps through structured spreadsheet systems to purpose-built aquaculture farm management software. Each level of the spectrum provides different capabilities, requires different investment, and is appropriate for different operation scales. A 500 m³ concrete tank operation with 10 grow-out tanks and two staff members producing 30 tonnes per year needs a different record-keeping system than a 5-hectare earthen pond operation with 20 ponds, 8 staff, and 200 tonnes per year production — and neither of them needs the system appropriate for a 1,000-tonne industrial production facility.
This guide covers the practical tool options at each level — what they do, what they cost, how to implement them, and what their real limitations are for catfish production management in the West and Central African operational context. It does not recommend a single universal solution because no such solution exists — it provides the evaluation framework for identifying the appropriate tool for a specific operation’s scale, budget, management capacity, and connectivity environment.
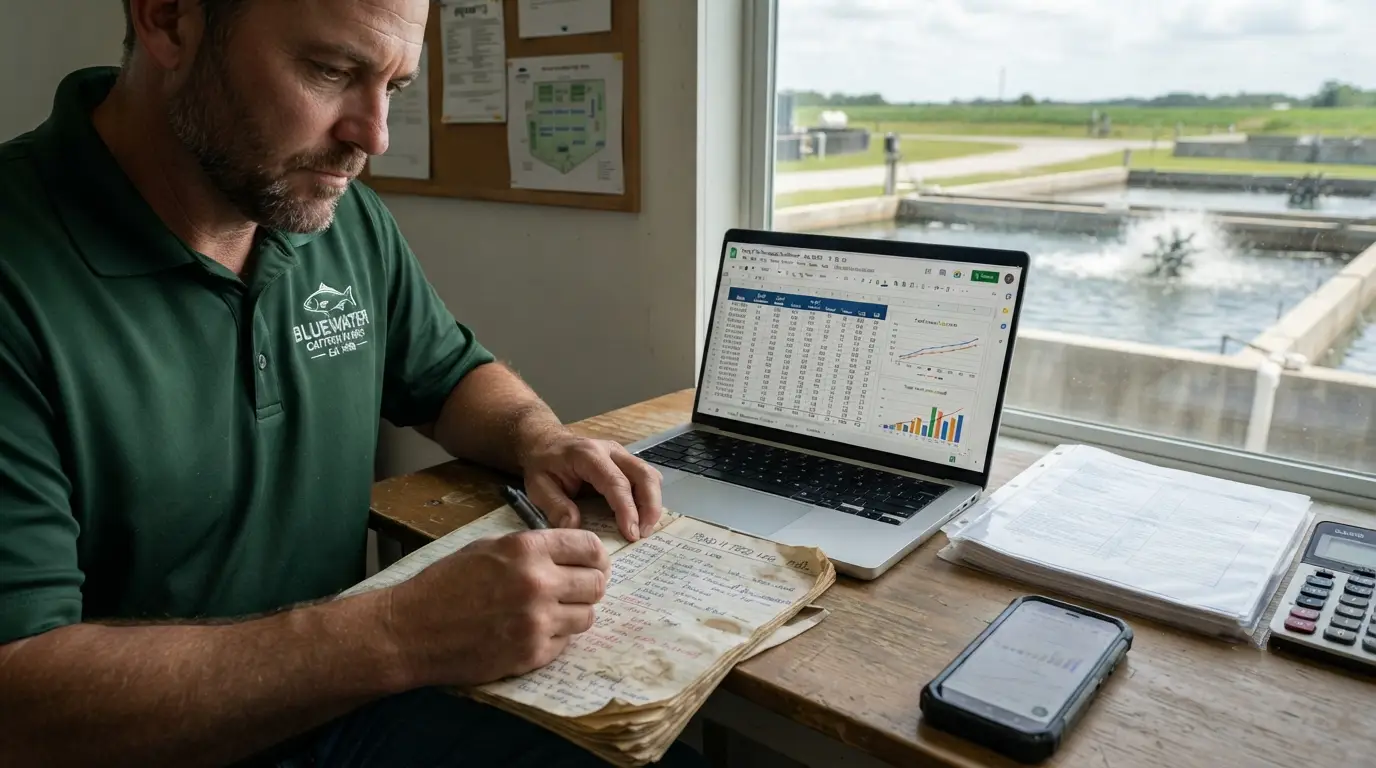
Why Digital Tools Improve On Paper Records
The Three Limitations of Paper Records
Paper-based record keeping has served commercial livestock and aquaculture production for centuries and remains entirely viable at small scale with disciplined management. Its limitations become production-relevant only at the scale where:
Limitation 1: Calculation burden prevents analysis
A farm manager maintaining paper records for 20 tanks must manually calculate FCR, SGR, population estimates, and daily ration updates for each tank each month. At 15 minutes of calculation per tank, this is 5 hours per month of arithmetic that produces no production value directly — only enables the management decisions that follow from it. When the calculation burden is large enough that it consistently does not get done, the management decisions that depend on it revert to impression-based rather than evidence-based.
Digital tools — even basic spreadsheet formulas — automate the arithmetic, reducing 15 minutes of calculation per tank to the 2 minutes required to enter the new measurement data and let the formula calculate the rest.
Limitation 2: Trend detection requires visual comparison of multiple data points
A paper record of monthly average weight for Tank 7 over 5 months is a column of five numbers. Whether those numbers represent normal growth, slowing growth, or accelerating growth requires the manager to hold multiple data points in mind simultaneously and calculate the change between them. A chart of those same five data points on a graph makes the trend immediately visible — a declining slope needs no calculation to recognize.
Digital tools generate charts from the same data that would require manual calculation to interpret from a paper table. The chart does not add information — it makes the information in the data visible faster and more reliably than arithmetic extraction.
Limitation 3: Paper records in one place cannot be accessed from another place
A farm manager reviewing paper records from the main farm office cannot simultaneously access them while in a distant grow-out pond area, discussing production performance with an investor remotely, or answering a buyer’s question about available harvest volume while at the market. Cloud-based digital records are accessible from any device with internet connectivity — production data from any tank is available in real time from any location.
What Digital Tools Do Not Fix
Before describing specific tools, it is important to state clearly what no digital tool can improve: the quality and consistency of the underlying data collection. A spreadsheet formula that calculates FCR from incorrect feed delivery records and estimated rather than measured fish weights produces incorrect FCR results more rapidly and with more apparent precision than the same incorrect data on paper — but it remains incorrect.
Digital tools amplify the value of good data. They also amplify the misleading appearance of precision from bad data. The prerequisite for useful digital records is the same data quality discipline described in the previous article — fish weights that are actually measured, feed deliveries that are actually weighed, mortality that is actually counted daily. No software replaces this field discipline.
Level 1 — Basic Calculator Apps and Mobile Tools
What They Provide and When They Are Appropriate
Scale: Single-operator farms, below 10 production tanks, production below 15 tonnes/year
The minimum viable digital upgrade from mental arithmetic and paper records is the consistent use of calculator functions — either a physical calculator, a smartphone calculator app, or the simple calculation functions in any standard mobile phone. For the calculations required in catfish farm management:
FCR calculation: Feed delivered ÷ Weight gained — a single division operation. Any calculator provides this.
Daily ration calculation: Biomass (kg) × Feeding rate (%) ÷ 100 — two operations. Any calculator provides this.
Growth rate calculation: Current weight − Previous weight, divided by days elapsed. Any calculator provides this.
These calculations take less than 30 seconds with any calculator. The barrier to performing them is not the tool — it is the discipline of collecting the input data (weighing fish, recording feed) and performing the calculation consistently rather than estimating.
Recommended Basic Mobile Apps for Farm Calculations
Google Calculator or built-in phone calculator: Adequate for all basic catfish farm calculations. No cost. Available on every smartphone.
Aquaculture Calculators (various free apps on Google Play and App Store): Several free mobile apps provide pre-built calculation interfaces for common aquaculture metrics — FCR, daily ration, growth rate, survival rate. These apps eliminate the need to remember formulas and reduce data entry to the raw measurements. Search “aquaculture calculator” in your phone’s app store — the specific apps available vary by region and update over time.
Unit converter apps: Useful for operations that receive weight data in different units from different equipment — converting between kg, g, and lb; between L/min and m³/hour; and between common aquaculture concentration units (mg/L, ppm, g/m³).
Voice Recording for Field Data Collection
One practical digital approach that improves data collection without requiring manual writing in field conditions (wet hands, bright sunlight, uncomfortable positions while weighing fish) is voice recording:
- Use the phone’s voice memo function to record measurements verbally while weighing fish: “Tank 7, 30 fish weighed, total 4.2 kg, date March 15”
- Transcribe recordings to the main record system (paper or digital) during the office portion of the day
- The voice record serves as backup verification if the transcription is questioned
Level 2 — Spreadsheet-Based Management Systems
Why Spreadsheets Are the Most Appropriate Tool for Most West African Catfish Operations
For commercial catfish operations producing 15–200 tonnes per year — the range encompassing the majority of commercial-scale producers in Nigeria, Cameroon, and across West Africa — purpose-built spreadsheet workbooks provide the most practical combination of calculation automation, cost (free or very low), offline capability (no internet required for operation once installed), and customizability for local conditions.
Spreadsheet software (Microsoft Excel, Google Sheets, LibreOffice Calc) is:
- Already present on most farm management computers or accessible through mobile apps
- Functional offline — critical in locations with unreliable internet connectivity
- Fully customizable to the specific production parameters of the farm
- Free (LibreOffice Calc, Google Sheets) or very low cost
- Operable by any person with basic computer literacy
Building a Catfish Farm Management Workbook
A complete catfish farm management spreadsheet workbook contains the following linked sheets:
Sheet 1: Tank/Pond Master List
A reference sheet listing all production units with their permanent characteristics:
- Tank/pond ID
- Volume (m³) or area (m²)
- Maximum designed stocking density
- Current production cycle number
- Current status (active production, fallow, cleaning)
Sheet 2: Stock Record (one row per stocking event per tank)
| Column | Content |
|---|---|
| Tank ID | Links to Tank Master List |
| Stocking date | Calendar date |
| Species/strain | — |
| Source hatchery | — |
| Initial count | Number stocked |
| Initial average weight (g) | From weighing at stocking |
| Target market weight (g) | Production goal |
| Target harvest date | Calculated from stocking date + expected cycle length |
| Feed type | Product name |
| Feed protein % | From label |
| Feed price per kg | Current purchase price |
Sheet 3: Monthly Weight Records
One row per tank per monthly weighing event, automatically linked to the Stock Record to calculate metrics:
| Column | Content | Formula |
|---|---|---|
| Date | Measurement date | Entered manually |
| Tank ID | — | Entered manually |
| Sample size | Number weighed | Entered manually |
| Average weight (g) | Calculated from total weight ÷ count | Entered manually or formula |
| Estimated population | Running count (stock minus mortality) | Links to mortality sheet |
| Estimated biomass (kg) | Avg weight × Estimated pop | Formula |
| ADG since last measurement (g/day) | (Current avg wt − Previous avg wt) ÷ Days elapsed | Formula |
| SGR (%/day) | (ln(W2) − ln(W1)) ÷ Days × 100 | Formula |
| Required daily ration (kg) | Biomass × Feeding rate% ÷ 100 | Formula |
| CV% | Std dev ÷ Mean × 100 | Formula |
| Days to market weight | (Target weight − Current avg wt) ÷ ADG | Formula |
| Projected harvest date | Today + Days to market weight | Formula |
Sheet 4: Daily Mortality Log
One row per day per tank with mortalities recorded:
| Column | Content |
|---|---|
| Date | Calendar date |
| Tank ID | — |
| Mortalities found | Number |
| Estimated weight of dead fish (g) | Visual estimate |
| Probable cause | Category selection from dropdown |
| Notes | Free text |
| Cumulative mortality | Running sum formula |
| Cumulative mortality % | (Cumulative ÷ Initial stock) × 100 |
| Daily mortality rate (%) | (Daily mortalities ÷ Current population) × 100 |
Sheet 5: Feed Delivery Log
One row per feed delivery per tank:
| Column | Content |
|---|---|
| Date | Calendar date |
| Tank ID | — |
| Feed type | Product name |
| Quantity delivered (kg) | Weighed quantity |
| Batch/lot number | From bag label |
| Manufacture date | From bag label |
| Feed price per kg | At time of purchase |
| Cumulative feed for this cycle | Running sum formula |
Sheet 6: FCR and Performance Summary (auto-calculated)
This sheet pulls data from the other sheets and calculates summary performance metrics automatically:
| Metric | Period | Formula Source |
|---|---|---|
| Period FCR | Month | Feed Sheet + Weight Sheet |
| Cumulative cycle FCR | Production cycle to date | Feed Sheet + Weight Sheet |
| Average daily gain (monthly) | Month | Weight Sheet |
| Population (estimated) | Current | Stock − Cumulative mortality |
| Days in production | Cumulative | Date − Stocking date |
| Feed cost to date (XAF) | Cumulative | Feed Sheet |
| Estimated harvest weight (kg) | At current trajectory | Weight Sheet projection |
| Estimated gross revenue | At current trajectory | Harvest weight × Market price |
| Estimated net margin | At current trajectory | Revenue − Costs |
Sheet 7: Water Quality Log
One row per measurement event per tank:
| Column | Content | Alert Formula |
|---|---|---|
| Date/time | Timestamp | — |
| Tank ID | — | — |
| DO (mg/L) | Measured | Red highlight if below 4 mg/L |
| Temperature (°C) | Measured | Red highlight if above 32°C or below 18°C |
| pH | Measured | Red highlight if outside 6.5–8.5 |
| TAN (mg/L) | Measured | Red highlight if above 1.0 mg/L |
| Nitrite (mg/L) | Measured | Red highlight if above 0.3 mg/L |
| NH₃ (calculated, mg/L) | Formula from TAN + pH + temp | Red highlight if above 0.02 mg/L |
| Action taken | Free text | — |
The conditional formatting advantage: Spreadsheet conditional formatting automatically highlights cells outside the defined acceptable range in a warning color — converting a data table into a visual alert system that draws attention to exceedances without requiring the reader to compare each value against a reference table manually.
Sheet 8: Treatment and Health Log
One row per treatment event per tank:
| Column | Content |
|---|---|
| Date | Calendar date |
| Tank ID | — |
| Condition treated | Diagnosis or presenting signs |
| Treatment product | Name |
| Dose/concentration | Mg/L or mg/kg or %BW |
| Duration | Days or hours |
| Withdrawal period (days) | From product label |
| Clearance date | Treatment date + Withdrawal period |
| Outcome | Response to treatment |
| Cost | Product cost + Labor |
The clearance date formula is the most critical food safety function in this sheet: A formula that calculates treatment start date + withdrawal period and displays the earliest safe harvest date prevents the accidental harvest of treated fish before withdrawal period completion.
Chart Templates for Trend Visualization
In the same workbook, add chart sheets that pull from the data sheets to display key trend visualizations:
Growth trajectory chart: Line chart plotting average weight over time for each tank — displayed against the target growth trajectory line from the production schedule. Tanks falling below the target line are immediately visually identifiable.
FCR trend chart: Bar or line chart showing monthly FCR for each tank over time — rising FCR is immediately visible as an upward trend on the chart.
Mortality accumulation chart: Area chart showing cumulative mortality percentage over time for each tank — abnormal mortality acceleration appears as a steepening slope that catches the eye before the percentage threshold is exceeded.
DO and ammonia charts: Time series charts of water quality parameters — a chart of pre-dawn DO readings over 30 days shows the gradual decline toward the stress threshold more clearly than a column of numbers.
Making the Spreadsheet Work in the West African Operational Context
Offline operation: Google Sheets can be configured for offline access — data entered when offline syncs automatically when internet connection is restored. Microsoft Excel works entirely offline. LibreOffice Calc works entirely offline and requires no internet subscription.
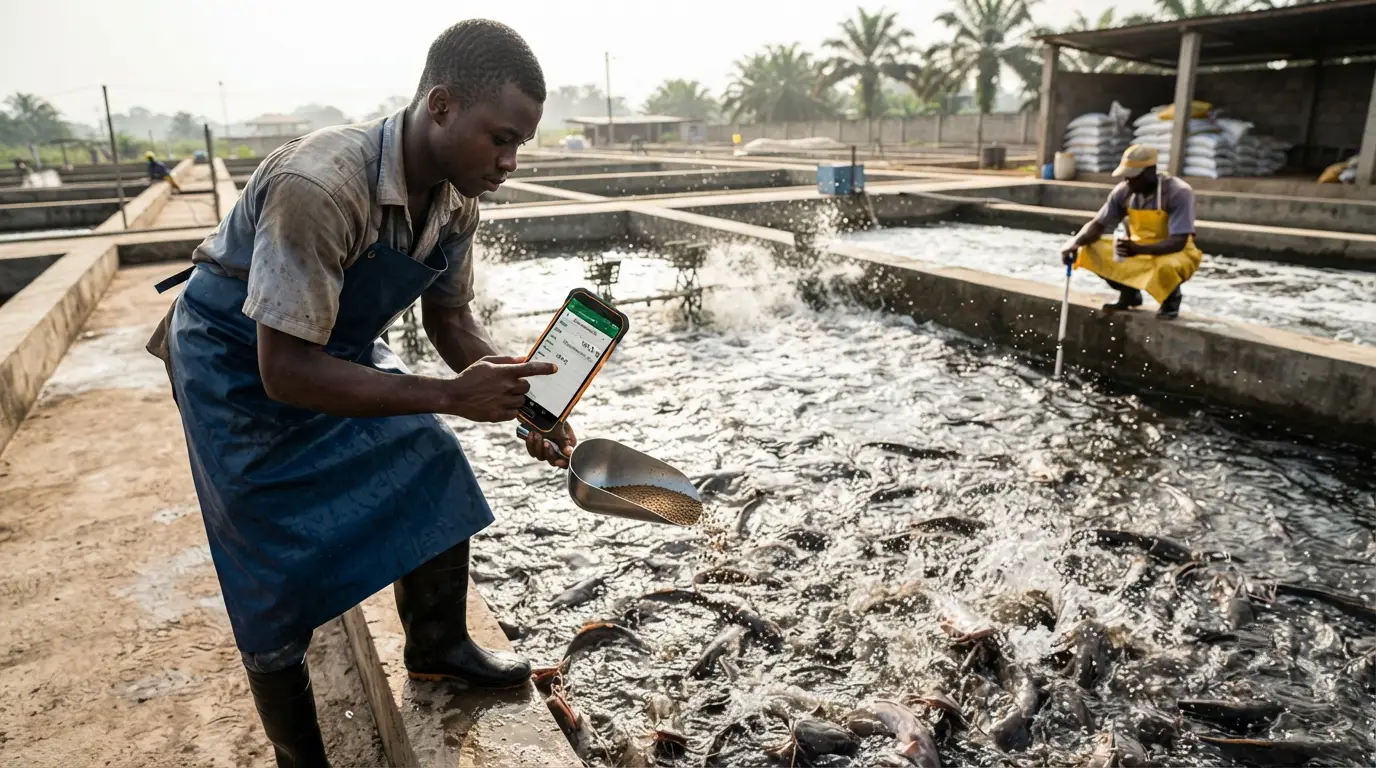
Mobile access: Google Sheets is fully functional on Android and iOS mobile apps — allowing field data entry directly from the phone at the tank or pond edge without returning to an office computer. This reduces the data entry lag between measurement and record and the transcription errors from writing to paper in the field and then entering to digital later.
Backup: Cloud-stored spreadsheets (Google Sheets, Office 365) are automatically backed up — a lost or damaged phone does not destroy the production records. For offline spreadsheets, regular manual backup to a USB drive or external storage is essential — a hard drive failure without backup destroys irreplaceable production history.
Template sharing: A well-designed catfish farm management spreadsheet template, once created, can be shared with multiple farms or staff members — allowing the same data structure across multiple tanks or farms and enabling direct comparison of production performance across sites.
Level 3 — Purpose-Built Aquaculture Farm Management Software
What Purpose-Built Software Provides Beyond Spreadsheets
Purpose-built aquaculture management software provides:
- Structured data entry forms that guide field staff through complete, consistent data entry without requiring familiarity with spreadsheet layout
- Automatic alert notifications (push notifications to phone or email) when monitored parameters exceed defined thresholds — replacing the visual scan of a spreadsheet with a direct alert to the responsible person’s device
- Multi-user access with role-based permissions — feeding staff can enter feeding records without access to financial data; managers can review all data; owners can monitor remotely
- Inventory management integration — feed purchases, medications, and equipment linked to their usage in production records
- Financial reporting that integrates production performance with cost and revenue data without manual transfer between systems
- Regulatory compliance documentation — automatic generation of the records required for certifications, antibiotic withdrawal period compliance, and food safety audits
Software Options Relevant to West African Catfish Operations
AquaManager:
One of the longer-established aquaculture farm management systems — web-based with mobile app access. Designed primarily for commercial aquaculture at medium-to-large scale. Subscription-based pricing.
Suitable for: Operations above 100 tonnes/year where the management complexity justifies the subscription cost and implementation effort. Multi-site operations where centralized data access and multi-user functionality are required.
Not suitable for: Small operations where the subscription cost exceeds the value delivered relative to a well-built spreadsheet.
Aquaspark:
A newer, mobile-first aquaculture management platform with modules for daily observations, health events, feeding management, and inventory. Designed to be accessible for farms in emerging markets with variable connectivity.
eFishery:
Particularly relevant for the West African context — eFishery is an agricultural technology company with specific focus on aquaculture in developing markets. Their platform provides automatic fish feeder integration (smart feeders that connect to the management system) alongside production monitoring. Strong presence in Asian markets; expanding into West Africa.
Farm management ERP systems adapted for aquaculture:
General agricultural ERP platforms (Agriware, Farmbrite, Granular) provide broader agricultural management capability — integrating aquaculture production with crop and livestock management for mixed farms. More complex implementation; potentially useful for diversified operations where aquaculture is one component.
Honest Assessment of Purpose-Built Software for West African Catfish Operations
Most commercial catfish operations in Nigeria and Cameroon currently operate at a scale and in a connectivity environment where purpose-built aquaculture software is not the highest-priority technology investment. The practical constraints are:
Internet connectivity reliability: Most purpose-built aquaculture management systems are cloud-based — they require consistent internet connectivity for data entry and access. In peri-urban and rural farm locations where internet access is intermittent, cloud-dependent systems create data entry gaps during connectivity outages.
Smartphone penetration and digital literacy: Data entry by field staff (who perform the daily measurements and observations) requires smartphones and sufficient digital literacy to navigate an app interface consistently. In operations where field staff literacy or digital comfort is limited, complex app interfaces create data quality problems from incorrect or incomplete entry.
Cost relative to operation scale: Subscription costs for quality aquaculture management software range from USD 50–500 per month — XAF 30,000–300,000 per month. For an operation producing 30–50 tonnes/year with feed cost as the dominant cost and thin margins, this subscription cost represents a significant overhead relative to the value delivered.
The verdict: For most West and Central African commercial catfish operations currently, a well-designed Google Sheets or Excel workbook — with the sheets, formulas, and charts described in Part 3 — provides 80% of the value of purpose-built software at near-zero cost. The remaining 20% (automated alerts, multi-user access with role permissions, regulatory compliance documentation) is worth the investment at scale — typically above 100–200 tonnes/year annual production where management complexity justifies the system cost.
IoT Sensors and Automated Monitoring
What Sensor-Based Monitoring Provides
Automated water quality monitoring — sensors installed in production tanks and ponds that continuously measure DO, temperature, pH, and other parameters, transmitting readings to a central display or mobile app — extends monitoring beyond what human-performed measurements can achieve:
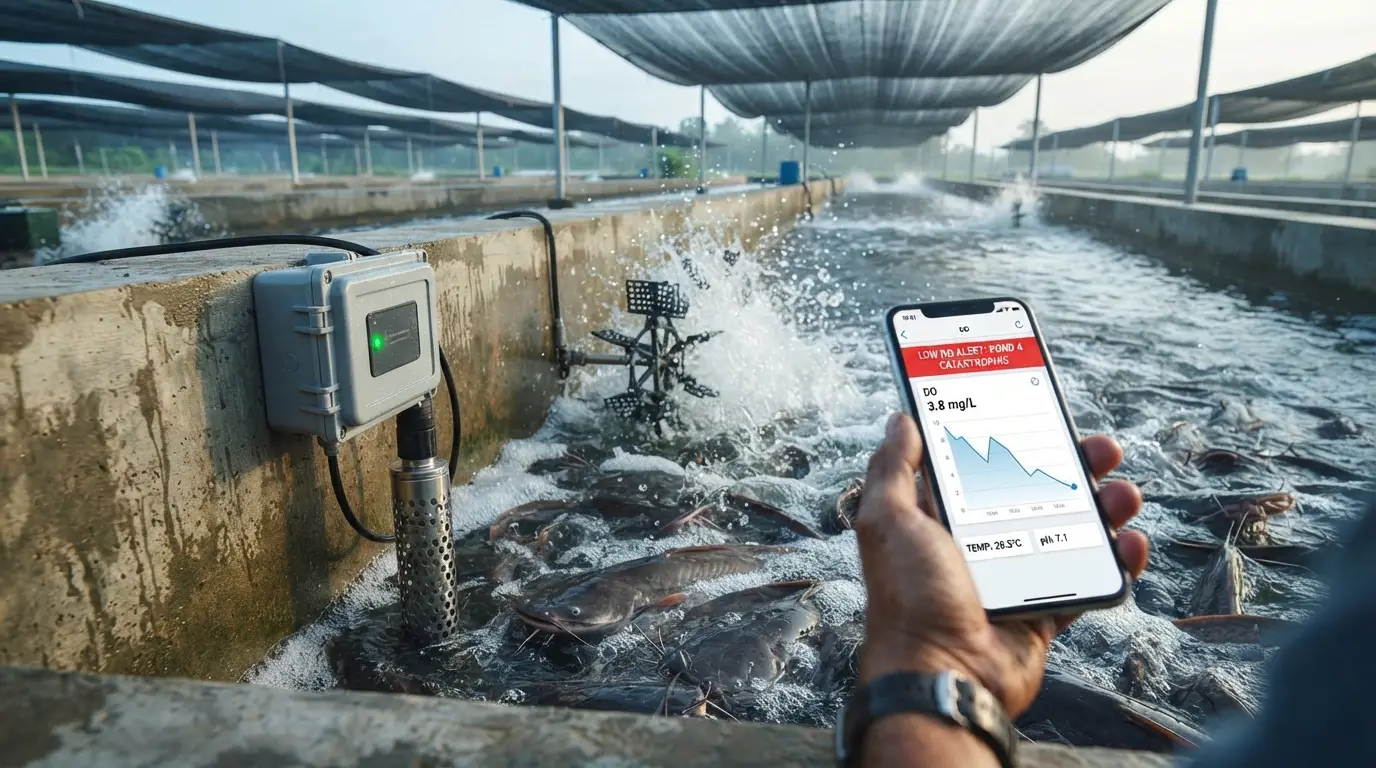
Continuous overnight monitoring: A sensor in each tank records DO every 5–15 minutes throughout the night — providing the pre-dawn DO minimum data that would otherwise require a staff member to be awake and measuring at 4 AM. An alert-configured system sends a push notification to the farm manager’s phone when DO falls below the set threshold — allowing emergency response before mass mortality rather than after.
Historical pattern analysis: Continuous sensor data, logged and stored, reveals patterns in water quality that spot measurements miss — the specific time of day when DO minimum occurs, the days when temperature peaks above the optimal range, the ammonia accumulation rate between water exchange events.
Reduced labor for routine monitoring: Where sensors replace some portion of daily manual water quality measurement rounds, the labor freed can be redirected to the higher-value activities that human presence is specifically required for (fish observation, feeding management, maintenance).
Sensor Options and Cost
Entry-level dissolved oxygen sensors with alarm: Simple DO monitoring units with temperature, displaying current reading and triggering a buzzer or alarm when DO falls below a set threshold. Cost: XAF 30,000–120,000 (USD 50–200) per unit.
Practical for: Overnight DO monitoring in high-biomass tanks during the hot season when dawn DO minimum is the critical management concern.
Multi-parameter water quality loggers: Submersible probes measuring DO, temperature, pH, and sometimes conductivity, logging readings to internal memory downloaded by USB or transmitting via Bluetooth to a phone app. Cost: XAF 180,000–600,000 (USD 300–1,000) per unit.
Practical for: Operations with the technical capability to maintain calibrated sensors and analyze downloaded data. Most appropriate for hatchery and broodstock tanks where water quality precision is most critical.
IoT-connected sensor systems: Sensors that transmit real-time data via WiFi or cellular network to a cloud dashboard — accessible from any device, with configurable alerts sent to designated phone numbers when thresholds are exceeded. Cost: XAF 300,000–900,000 (USD 500–1,500) per sensor node plus monthly connectivity fees.
Practical for: Operations with reliable internet connectivity, technical staff capable of maintaining connected devices, and scale sufficient to justify the investment. Most relevant above 100 tonnes/year production.
Connectivity Infrastructure for Sensor Systems
Sensor-based monitoring systems require the connectivity infrastructure to transmit data:
WiFi-based systems: Require WiFi coverage at all monitoring points — typically feasible for concrete tank operations with centralized infrastructure but challenging for earthen pond operations spread over multiple hectares without dedicated WiFi infrastructure.
Cellular-based systems (4G/LTE): Use the cellular data network for transmission — more practical for dispersed pond operations where running WiFi cable is impractical. Requires reliable cellular coverage at the farm location (verify signal strength before purchasing cellular-connected equipment).
LoRaWAN (Long Range Wide Area Network): A low-power wide-area network protocol specifically designed for IoT sensor applications — very long range (up to 15 km in rural areas), very low power consumption (sensor batteries last 2–5 years), and low data transmission cost. Requires a LoRaWAN gateway installation at the farm and connection to a LoRaWAN network provider. Increasingly relevant for large earthen pond operations where cellular coverage is inadequate.
Building the Digital Tool Stack — A Practical Implementation Sequence
The Implementation Sequence That Works
The most common digital tool implementation failure in commercial agriculture is attempting to jump directly to complex systems before the foundational data collection discipline is established. A farm that cannot consistently collect accurate daily feed weights, monthly fish weights, and daily mortality counts will not benefit from more sophisticated software — it will produce incorrect data faster, with more apparent precision.
Recommended implementation sequence:
Phase 1 (Months 1–3): Establish data collection discipline
Before any digital tool is introduced, establish consistent paper-based data collection for the four core measurements:
- Daily feed delivery (weighed, not estimated)
- Daily mortality (counted and recorded)
- Monthly fish weight (sampled and recorded)
- Daily water quality (measured, not estimated)
If these four data streams are not being collected consistently on paper, digital tools will not fix the collection problem — they will only give inconsistently collected data a better-organized storage location.
Phase 2 (Months 3–6): Implement basic spreadsheet system
Once paper data collection is consistent, build or obtain a spreadsheet workbook with the sheets described in Part 3, and begin entering the paper records into the digital system. This simultaneously:
- Introduces the digital workflow gradually
- Allows the formulas to begin calculating metrics automatically
- Provides the charts that make trend detection accessible
- Creates a backup of the paper records in digital form
Phase 3 (Month 6 onward): Transition to mobile-first data entry
Once the spreadsheet system is functioning and staff is comfortable with it, transition field data entry from paper-then-transfer to direct mobile entry (Google Sheets on phone at the tank or pond edge). This eliminates the transfer step and reduces transcription errors.
Phase 4 (Scale-dependent): Evaluate purpose-built software or sensor systems
When production scale reaches the threshold where the limitations of the spreadsheet system create genuine management problems (typically above 50–100 tonnes/year), evaluate purpose-built software. When the dawn DO minimum risk is critical and labor for overnight monitoring is a constraint, evaluate DO alarms and sensor systems.
Data Security and Continuity
Protecting Production Records
Production records accumulated over multiple production cycles represent significant business intelligence — the baseline data against which performance improvement is measured, the historical context for understanding current results, and the documentation required for financing, certification, and regulatory purposes.
The key data risks:
Device loss or failure: A phone or laptop that is lost, stolen, or fails without backup destroys all records stored only on that device. Cloud storage (Google Sheets, Office 365 OneDrive) automatically syncs data to cloud backup — the records survive device failure. Local-only storage (Excel files on a laptop hard drive without backup) is vulnerable to total loss.
Accidental deletion: Cloud-based systems maintain version history — accidental deletion or corruption can be reversed by restoring a previous version. Local files without version control cannot be recovered after accidental deletion.
Internet dependency: Cloud-based systems that cannot function offline create data gaps during connectivity outages. The hybrid approach — offline-capable apps (Google Sheets offline mode) that sync when connectivity is restored — provides continuity without connectivity dependency.
Recommended data protection practices:
- Use cloud-synchronized storage for all active production records
- Maintain weekly backup of the full workbook to a separate USB drive or external storage device stored off-site from the farm
- Store a complete production cycle archive in a separate folder at cycle completion — protecting historical data from accidental modification during current cycle data entry
Summary
Digital tools for catfish farm management exist on a spectrum from the calculator app on every farmer’s phone to purpose-built aquaculture management systems with IoT sensor integration — and the appropriate position on that spectrum depends on operation scale, technical capacity, connectivity environment, and the specific management problems the digital investment is intended to solve.
For the majority of commercial catfish operations in West and Central Africa currently — producing 15–200 tonnes per year, operating in environments with variable internet connectivity, and managed by teams with moderate digital literacy — a well-designed spreadsheet workbook provides the most practical balance of capability, cost, and reliability. It automates the arithmetic burden that prevents management analysis when performed manually, generates the charts that make performance trends visible, flags water quality exceedances with conditional formatting alerts, and calculates the critical food safety clearance dates for treated fish — delivering 80% of the value of purpose-built software at near-zero cost.
The prerequisite for any digital tool’s value — whether a spreadsheet or an IoT-connected sensor network — is the foundational data collection discipline established in the previous article. Accurate fish weights, weighed feed deliveries, counted daily mortality, and measured water quality are the raw material that all digital tools process. No software improves data quality. Every software tool benefits from it.
Build the data collection discipline first. Then build the digital tool that processes that data into management decisions. In that sequence, digital record-keeping transforms catfish farm management from impression-based to evidence-based — and evidence-based management consistently outperforms impression-based management on every metric that determines whether a commercial catfish operation is profitable.