The breed management guide is the most underused document in commercial layer farming. Most farmers receive it when they purchase day-old chicks, place it in a drawer, and retrieve it when production is already underperforming. By then, the management decisions that determined whether the flock would reach the guide’s performance targets — brooding conditions, vaccination timing, rearing nutrition, pullet uniformity, light stimulation timing — have already been made.
The performance standards in a modern layer breed management guide are not aspirational marketing. They are the quantified output of controlled research under defined conditions, documenting what the genetics of that breeding line produce when every input meets specification. They are the diagnostic baseline against which every management decision and every week of production data should be compared.
A farm manager who knows that Lohmann Brown Classic should be producing 92% laying rate at week 30 — and can see that their flock is at 81% at week 30 — has a specific, quantifiable production gap of 11 percentage points. They know exactly what production improvement looks like. They can calculate its financial value. And they have a specific investigation trigger: what is causing an 11-percentage-point deviation from the expected standard at this specific age?
Without the performance standard, the same farm at 81% might believe the flock is performing well, because it is better than the previous cycle, or because the farmer does not have a precise expectation for week 30. The standard converts impressions into measurements.
This article builds a complete understanding of the performance standards published by the major commercial layer genetics companies, what each metric measures, and why it matters, how the standards were generated and what conditions they assume, and how to use them as the management diagnostic tool they were designed to be.
The Genetics Companies and Their Standards
Three companies dominate global commercial layer genetics and publish the performance standards that define commercial egg production benchmarks:
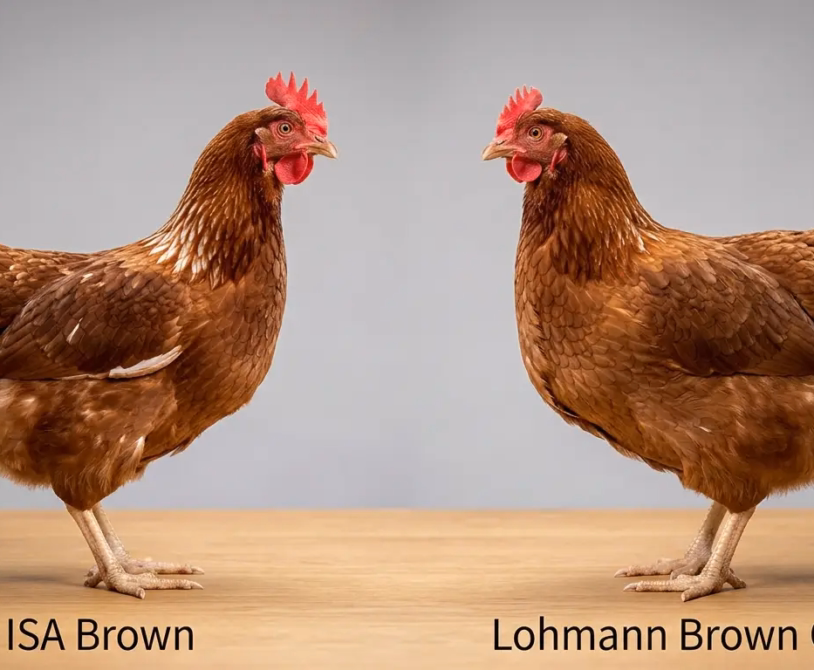
Hendrix Genetics (ISA division) — publishes performance standards for ISA Brown, ISA White, and other ISA line products. Standards available for download at hendrix-genetics.com and through regional distributors.
Lohmann Tierzucht GmbH — publishes standards for Lohmann Brown Classic, Lohmann Brown Extra, Lohmann LSL (white egg), and Lohmann Tradition. Standards available at ltz.de and through regional technical representatives.
Hy-Line International publishes standards for Hy-Line Brown, Hy-Line W-36, and other Hy-Line products. Available at hyline.com. Also publishes a quarterly technical newsletter (Hy-Line Technical Update) with performance data from global production environments.
Each company updates its performance standards periodically as genetic progress produces measurable improvements — the Lohmann Brown standard for hen-housed egg production at 72 weeks has increased approximately 15–20 eggs over the past decade through continued selection. A farm using a management guide from 2018 may be comparing against standards that the current genetics now exceed.
Always use the most current management guide for your specific breed line and chick year of production. Request the current version from your hatchery or directly from the genetics company’s regional representative.
The Core Performance Metrics: What Each One Measures
Metric 1: Hen-Housed Production Rate (HHP)
Definition: Total eggs produced by a flock divided by the number of birds housed on day one of production, expressed as a percentage or average eggs per bird.
Formula: HHP eggs/bird = Total eggs collected ÷ Number of hens housed at placement
Why it matters: HHP is the most comprehensive single production metric because it accounts for mortality. A flock with a 95% laying rate but 20% cumulative mortality produces fewer total eggs per bird housed than a flock with a 88% laying rate and 5% mortality. HHP captures the combined effect of both production rate and survivability on total egg output.
Breed standard examples (72-week cycle):
- Hy-Line W-36: 320–340 eggs HHP
- Hy-Line Brown: 310–325 eggs HHP
- ISA Brown: 305–320 eggs HHP
- Lohmann Brown Classic: 300–315 eggs HHP
- Lohmann Brown Extra: 310–325 eggs HHP
What the HHP standard assumes: Birds placed are Day-1 chicks of correct quality. Mortality from day 1 is included in the calculation (every bird that dies reduces HHP). The standard therefore, includes a mortality assumption of approximately 3–6% rearing period + 4–6% laying period — birds that perform within this mortality range while producing at the stated laying rate will meet the HHP standard.
Metric 2: Hen-Day Production Rate (HD)
Definition: Total eggs produced on a given day divided by the number of birds alive that day, expressed as a percentage.
Formula: HD (%) = Eggs collected today ÷ Birds alive today × 100
Why it matters: HD measures the intrinsic laying frequency of birds that are alive — it isolates the productivity of the surviving flock from the mortality effect. A high HD in a high-mortality flock still represents inefficient overall production because the mortality-depleted flock is producing fewer total eggs.
HD is the week-by-week management metric — tracking whether the laying rate of the surviving flock is meeting age-appropriate expectations.
Reading the HD production curve: Every breed management guide includes an expected HD production curve week by week from first egg to depopulation. This curve is the most important single reference document for weekly flock management. When actual HD falls more than 3–4 percentage points below the curve for two consecutive weeks, a management investigation is required.
Week-by-week HD targets for Lohmann Brown Classic (reference curve points):
| Week of Lay | Target HD Rate |
|---|---|
| Week 1 (wk 18–19 of age) | 5–20% |
| Week 2 (wk 19–20) | 20–50% |
| Week 4 (wk 21–22) | 60–80% |
| Week 6 (wk 23–24) | 82–90% |
| Week 8–10 (peak) | 90–95% |
| Week 20 (wk 37–38) | 88–92% |
| Week 30 (wk 47–48) | 84–88% |
| Week 40 (wk 57–58) | 79–84% |
| Week 50 (wk 67–68) | 73–78% |
Any flock running more than 5 percentage points below these reference points for more than two weeks is underperforming relative to genetic potential. The investigation begins at the point of deviation — not when the gap has widened to 10 or 15 points, and recovery is difficult.
Metric 3: Average Egg Weight
Definition: The average weight in grams of eggs produced by the flock, typically measured as the average of a representative sample collected over a week.
Measurement protocol: Weigh 30 eggs collected from three different collection rounds (10 from each round) on a calibrated digital scale accurate to ±1g. Calculate the average. Record weekly. Compare to the breed standard for the current week of lay.
Why egg weight matters beyond weight per se: Egg weight determines revenue in weight-graded markets (larger eggs command premium prices per unit) and directly affects FCR calculation (heavier eggs = less feed per kg of egg mass produced). A flock producing 0.93 eggs per hen per day at 58g average egg weight produces less egg mass and thus less revenue per kg of feed than the same flock at 63g average.
Breed standard egg weight curves (Lohmann Brown Classic):
| Week of Lay | Target Average Egg Weight |
|---|---|
| Week 2 | 52–56g |
| Week 4 | 56–60g |
| Week 8 | 59–63g |
| Week 12 | 61–64g |
| Week 20 | 62–65g |
| Week 30 | 63–66g |
| Week 40 | 63–66g |
| Week 50 | 64–67g |
Egg weight below standard indicates protein deficiency (specifically lysine or methionine) or water intake restriction — both reduce albumen secretion, which is the primary determinant of egg weight. An egg weight trend declining over 3–4 weeks with a stable laying rate is almost always nutritional or water-related, not a disease signal.
Egg weight above standard (rare but possible) indicates overfeeding of protein relative to energy — hens are producing heavier albumen but consuming more feed per egg, worsening FCR without proportional revenue gain in non-graded markets.
Metric 4: Feed Conversion Ratio (FCR)
Definition: Kilograms of feed consumed per kilogram of egg mass produced, or kilograms of feed per dozen eggs.
FCR (egg mass): Feed consumed (kg) ÷ Egg mass produced (kg)
FCR (dozen eggs): Feed consumed (kg) ÷ Dozens of eggs produced
Breed standard FCR benchmarks (at peak lay):
| Breed | FCR (kg feed/kg egg mass) | FCR (kg feed/dozen eggs) |
|---|---|---|
| Hy-Line W-36 | 1.85–1.95 | 1.22–1.28 |
| Hy-Line Brown | 1.95–2.05 | 1.35–1.42 |
| Lohmann Brown Classic | 2.00–2.10 | 1.36–1.43 |
| ISA Brown | 2.05–2.15 | 1.38–1.45 |
| Lohmann Brown Extra | 1.95–2.05 | 1.33–1.40 |
Interpreting FCR in practice: FCR worsens (increases) as the laying cycle advances — a normal biological progression. A FCR of 2.05 at week 30 and 2.35 at week 65 can both represent on-target performance for the respective cycle stage. Compare FCR against the breed standard for the current week of lay, not against a single fixed target across the cycle.
FCR above standard for the current week of lay indicates one or more of:
- Feed intake above standard (feeder overfilling, feed wastage, low-ME ration forcing higher volume consumption)
- Laying rate below standard (maintenance feed being consumed without proportional egg production)
- Egg weight below standard (less egg mass produced per unit feed)
- All three simultaneously: a systemic challenge event (disease, heat stress, nutritional deficiency)
Metric 5: Egg Mass
Definition: Total weight of eggs produced per hen per day, calculated as average egg weight × hen-day production rate.
Formula: Daily egg mass (g) = Average egg weight (g) × HD production rate (as decimal)
Example: 63g × 0.91 HD = 57.3g egg mass per hen per day
Breed standard daily egg mass (peak lay):
- Hy-Line Brown: 57–61g/hen/day
- Lohmann Brown Classic: 56–60g/hen/day
- ISA Brown: 56–60g/hen/day
Why egg mass is more informative than laying rate alone: A flock at 90% HD rate producing 59g average eggs generates 53.1g egg mass per hen per day. A flock at 88% HD rate producing 63g average eggs generates 55.4g egg mass per hen per day — more total egg weight despite lower egg count. In weight-graded markets, the second flock generates more revenue despite appearing to underperform on the simpler HD metric.
Egg mass is the integration of laying rate and egg weight — the single metric that best reflects the full production output per bird.
Metric 6: Livability
Definition: The percentage of housed birds that survive from placement to depopulation.
Formula: Livability (%) = Birds at depopulation ÷ Birds at placement × 100
Breed standard livability (72-week cycle):
- Hy-Line W-36: 93–96%
- Hy-Line Brown: 94–97%
- Lohmann Brown Classic: 95–97%
- ISA Brown: 94–96%
Interpreting livability: Cumulative mortality above 8% over a 72-week cycle indicates a systemic problem — poor biosecurity, inadequate vaccination, substandard nutrition, or housing conditions creating chronic stress. Cumulative mortality below 4% over the same period is exceptional management performance.
Monthly mortality rate target: below 0.5% per month during lay. Above 0.5% per month for two consecutive months triggers an investigation into the cause of mortality.
Metric 7: Uniformity at Point of Lay
Definition: The percentage of birds in a flock whose body weight falls within ±10% of the flock average at the time of light stimulation.
Standard target: Above 80% uniformity at week 16–17.
This metric was covered extensively in the uniformity article, but deserves inclusion here because it is published in breed management guides as a performance standard — not just as a rearing practice recommendation. Uniformity below 80% at the point of lay is documented in breed management research as a predictor of compressed peak production, prolonged lay onset spread, and reduced first-cycle persistency.
Metric 8: Body Weight at Key Stages
Definition: Average live body weight of the flock at specific age checkpoints during rearing and lay.
Why body weight targets matter: Body weight is the proxy for skeletal development, metabolic capacity, and reproductive readiness. A bird below body weight target at week 12 is not building the skeletal frame that medullary bone will fill. A bird below target at week 16 will not respond to light stimulation as a mature reproductive animal. A bird above the target at week 12 is depositing fat that will later impair reproductive efficiency.
Tracking body weight against the breed standard weekly is the most important single rearing management activity because it is the earliest visible indicator of nutritional, health, or environmental management failure — visible weeks before the failure appears in production records.
The Gap Between Standard and Reality: Why Most Flocks Underperform
The breed management guide performance standards are not achievable by most commercial layer farms in West and Central Africa under current conditions. This is not a criticism of West African farming — it is a reflection of the gap between the “optimum management conditions” under which the standards were generated and the conditions that exist on most commercial farms in the region.
The conditions assumed in the breed management guide performance standards:
- Temperature: Controlled environment at 18–24°C throughout the laying cycle — achievable only with tunnel ventilation and evaporative cooling
- Feed quality: Ration laboratory-verified for ME, crude protein, amino acids, and mineral content every batch — not yet standard practice at most commercial farms
- Water quality: Bacterial count below 100 CFU/mL at the drinker — requiring active sanitization and quarterly laboratory testing
- Vaccination: Confirmed by post-vaccination serology showing HI titers above 4 log₂ — not routinely done at most commercial farms
- Biosecurity: Structured zone biosecurity with documented visitor log, vehicle disinfection, and staff entry protocol — implemented at some but not all commercial farms
The expected performance gap under typical Cameroonian conditions:
| Metric | Breed Guide Standard | Expected Under Typical Conditions | Gap |
|---|---|---|---|
| Peak HD rate | 92–96% | 80–88% | 5–15 percentage points |
| Average laying rate (full cycle) | 78–82% | 68–76% | 6–12 percentage points |
| FCR at peak lay | 2.00–2.15 | 2.15–2.45 | +0.15–0.30 |
| Cycle eggs per bird housed | 300–320 | 250–280 | 30–50 eggs |
| Cumulative mortality (72 weeks) | 5–8% | 8–15% | 3–7 additional percentage points |
The financial value of closing the gap:
For a 1,000-bird farm, closing the gap from “typical conditions” performance to “breed standard” performance:
- Additional eggs per cycle: 35 eggs/bird × 1,000 birds = 35,000 eggs
- Revenue at XAF 140 (USD 0.23) per egg: XAF 4,900,000 (USD 8,167) per cycle
- FCR improvement (0.20 kg/kg reduction × 21,700 kg egg mass): 4,340 kg feed saved × XAF 350/kg = XAF 1,519,000 (USD 2,532) per cycle
- Total gap closure value: XAF 6,419,000 (USD 10,698) per cycle
This XAF 6.4 million (USD 10,698) is the value of closing the gap between typical and standard performance — the financial return on the management investments (feed quality verification, water testing, vaccination serology, lighting program upgrade) documented throughout this series. The breed standard is not an academic target. It is the financial benchmark that quantifies what precise management is worth.
Using the Performance Standard as a Weekly Diagnostic Tool
The breed management guide is most valuable not as a document read once at flock placement but as a weekly reference that every performance measurement is compared against.
The Weekly Standard Comparison Protocol
Every Monday morning, for each laying house:
- Calculate last week’s hen-day production rate
- Look up the breed standard for this flock’s current week of lay
- Calculate the variance: actual HD − standard HD
- Calculate last week’s average egg weight and compare it to the breed standard for this week
- Calculate cumulative FCR and compare to the breed standard range for this production stage
- Plot all three metrics on the trend chart
Trigger thresholds for investigation:
- HD rate more than 5 percentage points below standard for 2 consecutive weeks: investigate
- Average egg weight more than 3g below standard for 2 consecutive weeks: investigate
- FCR more than 0.15 above standard for 2 consecutive weeks: investigate
- Weekly mortality above 0.5% of the current flock for 2 consecutive weeks: investigate
Trigger thresholds for immediate action:
- HD rate more than 10 percentage points below standard in a single week: immediate flock health assessment
- Daily mortality above 0.1% of the flock on any single day: necropsy examination that day
- Egg weight decline of more than 5g over 2 weeks: water intake and nutritional assessment that day
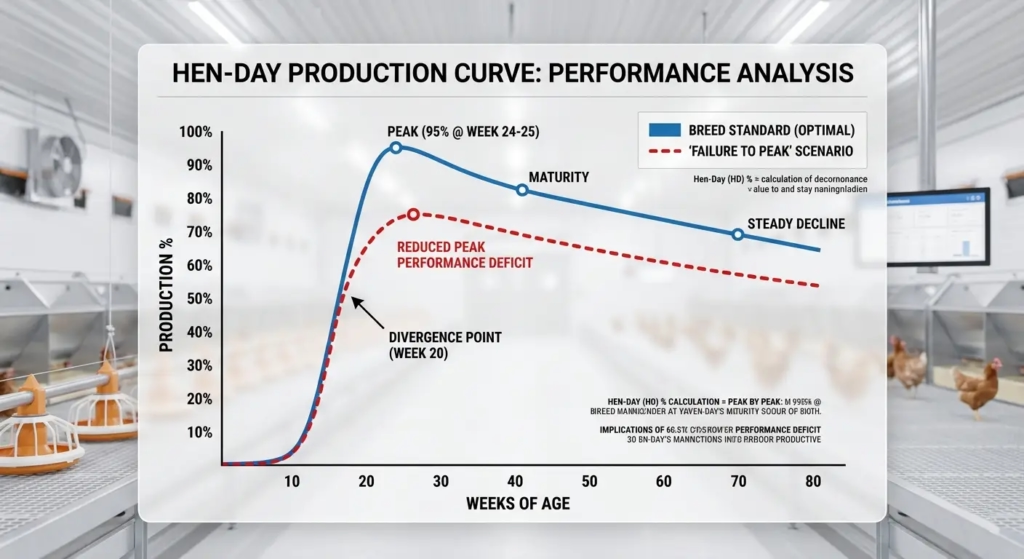
Reading the Production Curve as a Diagnostic Shape
The production curve — HD rate plotted weekly from first egg to depopulation — has a characteristic shape under good management: steep rise from 5% to peak over 6–8 weeks, a sustained plateau at 90–96% for 20–30 weeks, then a gradual linear decline of 0.2–0.4% per week through late lay.
Deviations from this characteristic shape are diagnostic:
Sharp production dip followed by recovery: A single-week dip of 5–8% followed by return to the curve is typically a management event — a vaccination that temporarily suppressed feed intake, a one-day water interruption, a power cut disrupting the lighting program. These resolve without intervention beyond identifying and correcting the cause.
Gradual decline from peak to below the expected curve: The flock’s production is declining faster than the breed standard curve predicts. Most common cause: laying ration calcium or energy inadequacy in late lay, combined with declining absorption efficiency. The ratio needs adjustment upward for both.
Failure to reach expected peak: The flock reached 78–82% but never reached the expected 90–94%. Most common cause: a rearing period management failure — inadequate pullet uniformity at light stimulation, premature or delayed stimulation, or a rearing disease event that caused immunosuppression. The peak failure is a rearing problem visible in the laying record.
Sustained below-standard production from week 1 of lay: The flock produces 75–80% from onset and never improves. Most common cause: pullets were transferred with inadequate body weight or uniformity, combined with a housing transition or nutritional gap that was not corrected in the first 4 weeks of lay. The laying house conditions did not trigger the full reproductive axis activation that well-prepared pullets would show.

Interpreting Variance from Standard: When Is It Acceptable?
Not all variance from the breed standard is a management failure. Some variance is expected from biological variation between flocks, seasonal production cycles, and the specific conditions of each farm. The question is not whether variance exists but whether it is within the acceptable range and whether its cause is understood.
Acceptable variance ranges (no investigation triggered):
- HD rate: within ±3 percentage points of breed standard for the current week
- Average egg weight: within ±2g of breed standard for the current week
- FCR: within +0.10 of the breed standard for the current production stage
- Cumulative mortality: within 1 percentage point of the breed standard cumulative
Investigation-triggered variance:
- HD rate: greater than ±5 percentage points for 2 consecutive weeks
- Average egg weight: greater than ±3g for 2 consecutive weeks
- FCR: greater than +0.15 for 2 consecutive weeks
- Cumulative mortality: greater than 2 percentage points above breed standard
Immediate action variance:
- HD rate: greater than 10 percentage points below standard in any single week
- Egg weight: greater than 5g below standard in any single week
- Daily mortality: above 0.1% on any single day
The Genetic Progress Story: How Standards Have Changed
Understanding that breed management guide standards are not fixed — they improve as genetic selection advances — provides context for the extraordinary performance targets current management guides specify.
Historical performance progression for commercial brown-egg layers:
| Decade | Peak HD Rate | Hen-Housed Eggs (72 weeks) | FCR (kg/kg egg mass) |
|---|---|---|---|
| 1970s | 75–82% | 200–230 | 2.60–2.90 |
| 1980s | 80–86% | 235–260 | 2.35–2.60 |
| 1990s | 85–90% | 260–280 | 2.20–2.40 |
| 2000s | 88–93% | 270–295 | 2.10–2.25 |
| 2010s | 91–95% | 290–315 | 2.00–2.15 |
| 2020s | 93–97% | 310–340 | 1.85–2.10 |
Each decade’s improvement represents the accumulated selection pressure of hundreds of generations of commercial layer genetics — selecting the most productive birds in each generation and using their offspring as the parent flock for the next generation. The 2020s commercial layer hen produces approximately 40% more eggs on 30% less feed than her 1970s genetic ancestor. That genetic progress is the foundation that management systems are designed to capture.
The performance targets in today’s breed management guides are not aspirational. They are the documented output of birds that currently exist and produce these numbers in properly managed commercial environments around the world. The gap between what Cameroonian layer farms achieve and what the breed guide specifies is not a genetic limitation. It is a management and environment limitation — one that this entire article series has documented how to close.
Summary
The performance standards in a breed management guide are the most important management reference document on the farm — more important than any veterinary prescription, more important than any feed formulation, more important than any equipment specification. They define the genetic ceiling that management is trying to reach and the specific diagnostic benchmark against which every week of actual production should be measured.
A farm that compares its weekly production rate, egg weight, FCR, and mortality against breed-standard benchmarks is managing with precision. A farm that does not make this comparison is managing without a target — and without a target, every deviation from potential is invisible until it has cost weeks of production.
Read the breed management guide. Keep the current version on the farm desk. Compare actual performance against standard performance every week. Investigate deviations promptly. Let the standard be not just the ceiling to aspire to but the diagnostic ruler against which every management decision is measured.
The genetics are delivering what they were selected to deliver. The management system determines how much of that delivery reaches the egg tray.