The difference between a commercial pig farm that consistently performs at or near its genetic and nutritional potential and one that persistently underperforms is rarely a single dramatic failure. It is the accumulation of small, undetected deteriorations — a pre-weaning mortality rate that has drifted from 9% to 14% over eight months, an FCR that has worsened from 2.65 to 2.95 across three production cycles, a weaning-to-estrus interval that has extended from 5 days to 8 days through a summer heat period — each individually explainable by circumstance, collectively representing hundreds of millions of XAF in avoidable production loss that a disciplined records system would have detected and corrected at the first sign of drift.
Records do not improve performance directly. They create visibility — the ability to see what is actually happening rather than what the farm manager believes is happening. Most experienced pig farmers, asked to estimate their farm’s current PSY, FCR, or pre-weaning mortality, will give a number. The number they give and the number that emerges from calculating it from actual records frequently differ by 15–25%. The farm that believes it is performing at PSY 22 and is actually performing at PSY 17 is making operational, financial, and investment decisions based on a false understanding of its current position.
This guide covers the complete records system for a commercial pig farm: the records that must be maintained, the metrics those records generate, the review frequency appropriate for each metric, and the diagnostic logic for converting a metric that is outside target range into an identified, addressable management problem.
The Philosophy of Records — What Makes a Records System Work
Records Are Decision Support, Not Documentation
The most common failure in farm records systems is treating records as documentation — creating the appearance of record-keeping (writing things down) without the discipline of record-using (actually reading the records, calculating the metrics, and acting on what they show). A farrowing record that sits in a folder uncalculated is not a record system — it is a paper-accumulation system.
A functional record system has three components:
Data capture: Writing down the specific events and measurements that generate the data (farrowings, mortalities, weights, feed deliveries)
Metric calculation: Converting the raw data into the calculated metrics (PSY, FCR, pre-weaning mortality rate) at defined intervals
Decision response: Using the metric trends to make specific management decisions — not simply observing that a metric has worsened, but identifying the probable cause and implementing a specific corrective action
Without the third component, the first two are wasted effort.
The Minimum Viable Records System
For a small commercial operation (under 30 sows), a paper-based records system with monthly metric calculation is adequate — provided it is consistently maintained and consistently used. For operations above 50 sows, a simple spreadsheet-based system that automates metric calculation from entered data significantly reduces the labor of the calculation step and makes the decision-response step easier to execute consistently.
The records forms described in this guide can be maintained on paper or in a simple spreadsheet. What matters is not the medium — it is the consistency of data capture and the discipline of metric review.
Reproductive Records — The Foundation of Herd Productivity
The Individual Sow Card
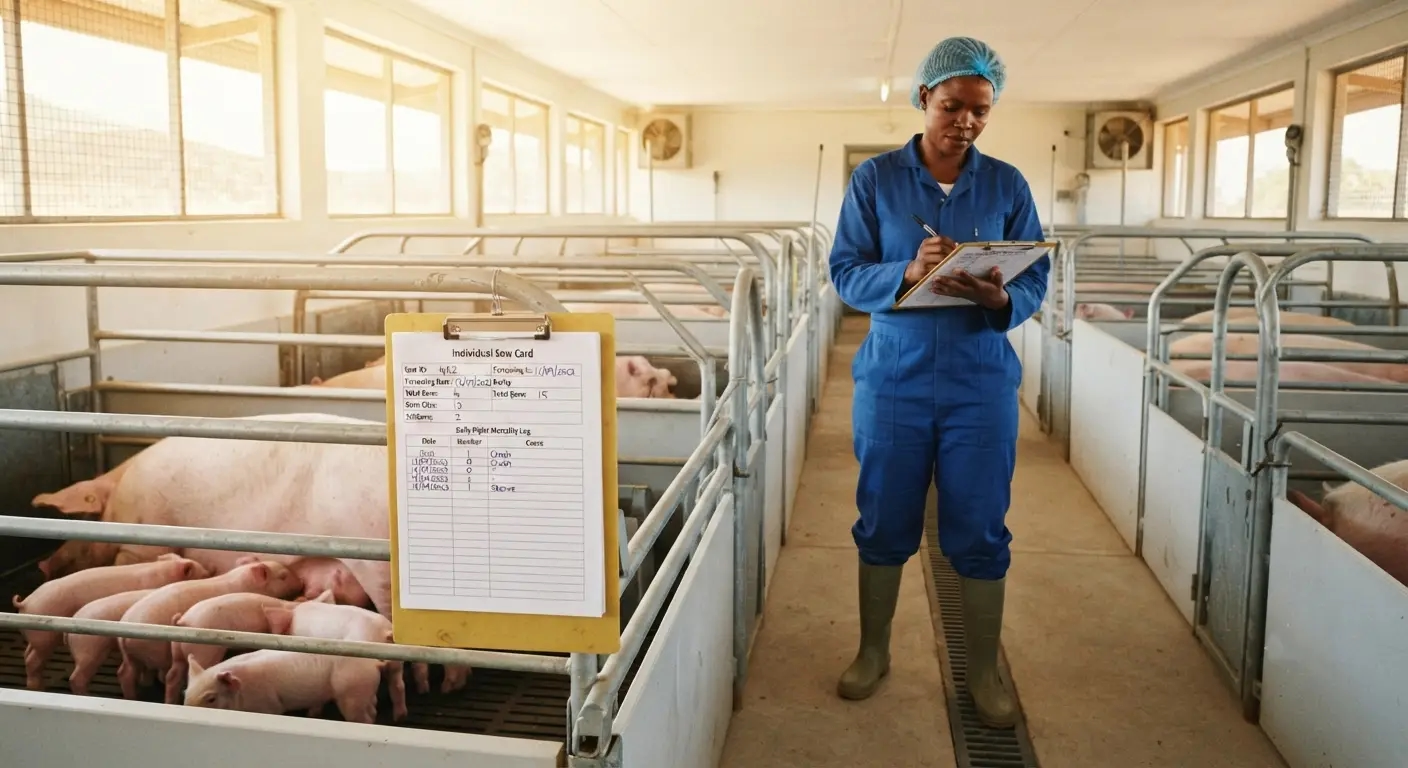
Every sow in the breeding herd requires an individual production record — a card, page, or digital record that accumulates her complete reproductive history from first service through each subsequent parity until culling. This is the primary source document from which all reproductive metrics are calculated.
Minimum content of an individual sow card:
| Data Field | When Recorded | Why It Matters |
|---|---|---|
| Sow identification (ear notch or tag number) | At gilt entry | Unique animal identifier for all records |
| Date of birth/age | At gilt entry | Allows parity-by-age tracking |
| Date entered production herd | At end of quarantine | Establishes the animal’s tenure in the herd |
| Parity number | At each farrowing | Tracks performance by parity |
| Service date(s) | Each service event | Basis for expected farrowing date calculation |
| Boar or semen batch used | Each service | Links service to semen quality data |
| Expected farrowing date (service date + 114–116 days) | Calculated at service | Scheduling and attendance planning |
| Actual farrowing date | At farrowing | Confirms gestation length, enables interval calculation |
| Total born (TB) | At farrowing | Complete litter size including stillborn and mummies |
| Born alive (BA) | At farrowing | Live piglet production |
| Stillborn | At farrowing | Farrowing difficulty indicator |
| Mummified | At farrowing | PRRS and other viral reproductive pathogen indicator |
| Birth weight (litter total or average) | At farrowing (optional but valuable) | Sow nutrition adequacy indicator |
| Number weaned | At weaning | The commercially critical reproductive output |
| Weaning date | At weaning | Establishes the weaning-to-service interval start |
| Weaning weight (litter total or average) | At weaning | Lactation performance indicator |
| Date of next service | At next service | Allows WEI calculation |
| Any treatments administered during the cycle | When given | Health history and treatment efficacy tracking |
| Outcome notes | As needed | Cull reason, complication description, exceptional events |
The parity-by-parity longitudinal view: The individual sow card, maintained consistently across parities, allows the farm to identify:
- Individual sows with persistently below-target litter size (candidates for culling)
- Sows with extended WEI in specific cycles (nutritional or health issue investigation targets)
- The parity at which each sow’s performance peaks and begins to decline (informing optimal cull timing)
- The relationship between farrowing difficulties and subsequent cycle performance (a sow with a difficult parity 3 may show reduced parity 4 performance as a predictable consequence)
The Breeding Register
Separate from individual sow cards, a breeding register logs all services in chronological order — allowing the farm manager to see at a glance which sows are in which stage of their reproductive cycle at any given time.
Breeding register columns:
| Column | Content |
|---|---|
| Service date | Calendar date |
| Sow ID | Ear notch or tag number |
| Parity | At time of service |
| Expected farrowing | Calculated date |
| Pregnancy check date | 25–35 days post-service |
| Pregnancy check result | Positive / Negative / Repeat |
| Return date (if applicable) | Date of repeat service after failure |
| Actual farrowing date | When completed |
The breeding register doubles as the farm’s farrowing schedule — scanning forward 114–116 days from each service date gives the expected farrowing calendar that determines farrowing house occupancy planning, staffing for attended farrowing events, and the creep heating and crate preparation timing.
Farrowing and Pre-Weaning Records
The Farrowing Record
For each farrowing event, record:
| Data | Specific Recording Requirement |
|---|---|
| Sow ID and parity | Verify against individual sow card |
| Farrowing date and time | Date (and approximate time where attended farrowing is practiced) |
| Farrowing duration (first to last piglet) | Hours and minutes — prolonged farrowing (above 4 hours) flags dystocia risk |
| Total born, born alive, stillborn, mummies | Individual counts |
| Interventions required | Manual assistance, oxytocin, calcium — documents complication history |
| Colostrum assessment | Milk letdown quality at time of farrowing (excellent/adequate/poor) |
| Iron injection (date given, dose) | Confirms neonatal protocol completion |
| Piglets processed (tail docking, ear notch applied, castration if male) | Confirmation of processing completion and notch number assigned |
| Foster-ons or foster-offs (if cross-fostering occurred) | Net litter size after fostering |
| Litter weight at 24 hours (optional but valuable) | Early indicator of colostrum intake adequacy |
The Pre-Weaning Mortality Log
For each piglet death before weaning:
| Data | Recording Requirement |
|---|---|
| Date of death | Calendar date |
| Sow ID | Links to individual sow card |
| Piglet age at death (days) | Allows mortality clustering analysis by age |
| Estimated cause | Crushing / Starvation (low viability) / Chilling / Disease / Congenital / Unknown |
| Piglet weight at death (where practical) | Confirms low-birth-weight pattern if present |
Why the cause-of-death estimate matters: Aggregating pre-weaning deaths by estimated cause — even farm-staff-level estimates that may not be veterinary-confirmed — reveals the dominant cause in the specific herd and guides the specific preventive investment:
- Crushing dominating (above 30% of deaths): Prioritize farrowing crate guard rail position verification, creep heating adequacy, and high-risk sow monitoring intensity
- Starvation/low viability dominating (above 25% of deaths): Prioritize litter size management, split nursing, fostering protocols, and colostrum adequacy
- Disease dominating (above 20% of deaths): Prioritize diagnostic investigation, vaccination program review, and farrowing house hygiene protocols
Growing and Finishing Records
The Pen Performance Record
For each pen of growing or finishing pigs:
| Data | Recording Requirement | Frequency |
|---|---|---|
| Pen ID and building location | Established at pen occupancy | Once |
| Stocking date and number stocked | At pen fill | Once |
| Average weight at stocking | Weigh minimum 15 pigs, record average | At stocking |
| Average weight mid-period | Weigh minimum 15 pigs | Monthly |
| Average weight at departure | Weigh minimum 15 pigs | At market or pen transfer |
| Feed delivered | Weigh each delivery — not estimated | Each delivery |
| Feed remaining at weighing dates | Estimate by inspection | At each weighing |
| Mortalities (date, estimated cause) | Each event | As they occur |
| Treatments administered (date, medication, dose, number treated) | Each treatment event | As they occur |
| Departure date and destination | At sale | At market |
| Final sale weight and price | At sale | At market |
The calculated metric from pen records:
FCR = (Total feed delivered − Feed remaining at end) ÷ (Total weight gained = Departure weight − Stocking weight)
Average daily gain = (Departure average weight − Stocking average weight) ÷ Days in pen
These two calculations — FCR and ADG — are the primary performance indicators for the growing and finishing phase, and they require nothing more than the records listed above: feed weights, pig weights, and dates.
The Feed Inventory Record
Feed inventory tracking is a prerequisite to accurate FCR calculation and to the financial management of the operation’s largest cost line:
| Data | Recording Requirement |
|---|---|
| Date of feed purchase or delivery | Each event |
| Feed type (starter/grower 1/grower 2/finisher/sow lactation, etc.) | Each delivery |
| Supplier | Each delivery |
| Quantity received (kg) | Weighed — not estimated from bag count |
| Price per kg | Each purchase |
| Feed delivered to each pen (kg) | Each feeding event |
| Feed inventory balance | Calculated running balance |
The inventory balance calculation: (Opening stock + Delivered) − (Delivered to pens + Losses) = Closing stock
Any significant discrepancy between the calculated closing stock and the physical stock at inventory count indicates either feed theft, significant wastage, or measurement error — each of which requires investigation.
Health Records
The Treatment Log
For every medication administered to any pig or group of pigs:
| Data | Recording Requirement |
|---|---|
| Date of treatment | Calendar date |
| Animal ID or pen number (for group treatments) | Identifies the treated population |
| Number of animals treated | Count |
| Condition being treated | Diagnosis or presenting signs |
| Medication used | Product name, not generic description |
| Batch number and expiry date | From the medication container |
| Dose administered | mg/kg or mL/animal |
| Route of administration | IM/SC/oral/etc. |
| Withdrawal period end date | Treatment date + label withdrawal period — critical for market timing |
| Outcome assessment (improvement/no change/death) | Follow-up entry at 3–5 days |
The withdrawal period tracking is the most operationally critical function of the treatment log. Any pig sold within the withdrawal period of any medication it has received is a food safety violation that can result in regulatory action, market access loss, and reputational damage. The treatment log, maintained correctly and checked against planned market dates, is the only reliable system for preventing withdrawal period violations.
The Mortality Record
For every pig that dies at any production stage:
| Data | Recording Requirement |
|---|---|
| Date | Calendar date |
| Production stage and pen | Building location |
| Animal ID (if individually identified) | Ear tag or notch |
| Age | Days or weeks |
| Weight at death (where practical) | Weighed or estimated |
| Findings at post-mortem (even basic farm-level assessment) | Gross lesion description |
| Estimated cause of death | By category |
| Disposal method and date | Confirms biosecurity-compliant disposal |
The Vaccination Record
For every vaccination event:
| Data | Recording Requirement |
|---|---|
| Date | Calendar date |
| Animals vaccinated (pen, group, or individual ID) | Identifies the vaccinated population |
| Number vaccinated | Count |
| Vaccine product name | From the label |
| Manufacturer and batch number | From the label |
| Expiry date | From the label |
| Dose and route | As per product label |
| Cold chain verification | Temperature at time of use (was the vaccine correctly stored?) |
| Administrator | Person who gave the vaccine |
Part 6: Financial Records
The Minimum Financial Records System
| Record | Content | Frequency |
|---|---|---|
| Revenue log | Date, buyer, number of pigs, weight, price per kg, total received | Per transaction |
| Expenditure log | Date, supplier, item, quantity, price per unit, total paid | Per transaction |
| Feed purchase summary | Total kg, total cost, cost per kg by feed type | Monthly |
| Cash flow statement | Cash received minus cash paid, running balance | Monthly |
| Profit and loss statement | Revenue minus all costs, net profit/loss | Monthly |
The monthly profit and loss statement requires no accounting expertise to produce from these records — it is the revenue log total minus the expenditure log total for the same period. This single number, tracked monthly, reveals whether the operation is covering its costs in each operating period and how the trend is moving over time.
The Core Metrics — What to Calculate and When
The Reproductive Metric Dashboard
Calculate monthly, review monthly:
| Metric | Formula | Target | Review Action if Below Target |
|---|---|---|---|
| PSY | Pigs weaned ÷ average sow inventory × (365 ÷ days in period) | 20–25 | Investigate farrowing rate, litter size, WEI |
| Farrowing rate | Farrowings in period ÷ services in period × 100 | Above 85% | Investigate conception rate, heat detection accuracy, semen quality |
| Average litter size (BA) | Total born alive ÷ total farrowings | 11–13 | Investigate sow nutrition, disease (PRRS/PPV), parity distribution |
| Pre-weaning mortality rate | Pre-weaning deaths ÷ born alive × 100 | Below 10% | Investigate by cause — crushing, starvation, disease, chilling |
| Pigs weaned per litter | Total pigs weaned ÷ total litters weaned | 10–12 | Derivative of BA and PWM — address the root cause metric |
| Weaning-to-first-service interval (WSI) | Days from weaning to first service (average) | Below 7 days | Investigate sow BCS at weaning, lactation feed intake, boar exposure |
| Non-productive sow days (NPD) | 365 − (farrowings per year × (avg lactation + 115)) per sow | Below 35 | Composite metric — investigate the specific interval component extending NPD |
Calculate quarterly, review quarterly:
| Metric | Formula | Target |
|---|---|---|
| Sow replacement rate | Gilts introduced ÷ average sow inventory × 100 | 35–45% |
| Sow culling reason distribution | Breakdown of culls by reason: reproductive failure/lameness/age/disease | — |
| Average parity at culling | Mean parity of sows culled in the period | 5–7 parities (below 4 indicates premature culling) |
The Production Performance Metric Dashboard
Calculate per batch/cohort, review monthly:
| Metric | Formula | Target | Review Action if Below Target |
|---|---|---|---|
| FCR (grower-finisher) | Feed consumed ÷ weight gained (pen level) | 2.4–2.8 | Investigate health status, water access, temperature, feed quality |
| Average daily gain | (End weight − Start weight) ÷ days in pen | 800–950 g/day | Derivative of FCR investigation |
| Days to market weight | Average days from weaning to 100 kg | 155–175 | Investigate genetics, nutrition, health, environment |
| Weaning to market mortality | Deaths during growing period ÷ pigs entered growing × 100 | Below 3% | Investigate PRRS/PCV2 status, stress at weaning, density |
| Feed cost per kg of gain | Feed cost (XAF) ÷ total weight gained (kg) | XAF 750–900 | Composite — FCR × feed price |
The Financial Metric Dashboard
Calculate monthly, review monthly:
| Metric | Formula | Target | Review Action |
|---|---|---|---|
| Revenue per pig | Total revenue ÷ pigs sold | Varies by market channel mix | Compare against price benchmarks and channel mix target |
| Feed cost per pig | Total feed cost ÷ pigs sold | XAF 75,000–100,000 | Investigate FCR, feed price, feed waste |
| Feed cost as % of revenue | Total feed cost ÷ total revenue × 100 | Below 65% | If above 65%, investigate both cost (FCR, price) and revenue (channel mix) |
| Net margin | (Revenue − Total costs) ÷ Revenue × 100 | 15–30% | Composite — investigate the specific cost line driving margin compression |
| Cash position | Cash on hand + receivables − payables | Positive at all times | Manage timing of large expenditures against cash availability |

Diagnostic Logic — Converting Metrics Into Management Decisions
The Diagnostic Cascade
When a metric is outside target range, the correct response is not immediately implementing a general “improvement” intervention — it is identifying the specific cause of the deviation through a structured diagnostic sequence:
Step 1: Determine whether the deviation is a trend or a single-cycle event
A single month of below-target farrowing rate may reflect a specific, non-recurring event (a batch of poor-quality semen from one boar, a heat stress event during one breeding period). Two consecutive months of below-target farrowing rate, or three months of worsening trend, indicates a systemic problem requiring investigation.
Step 2: Identify the specific component of the metric that is below target
A below-target PSY is always caused by one or more of four things: below-target litter size, below-target farrowing rate, extended WEI, or extended lactation length. The corrective action differs depending on which specific component is driving the PSY shortfall — treating them as interchangeable (implementing “PSY improvement” without specifying which component) produces diffuse effort with limited impact.
Step 3: Test the most probable specific hypothesis with the available data
Once the specific metric component is identified (for example, extended WEI is the PSY driver), the records should contain the data to test the most probable cause:
- Has sow BCS at weaning declined? (Check body condition assessments against the individual sow card records)
- Has lactation feed intake declined? (Check feed delivery records against pen occupancy numbers)
- Has the seasonal temperature pattern correlated with the WEI extension? (Correlate ambient temperature records with WEI data)
- Has the boar exposure protocol been consistently followed? (Check the breeding register for dates between weaning and first service)
Step 4: Implement the specific corrective action for the identified cause
The corrective action should be specific and measurable — “increase lactation feed allocation by 10% and recheck WEI in the next farrowing batch” is a specific intervention with a testable hypothesis. “Improve sow management” is not.
Step 5: Verify the correction worked
After implementing the specific corrective action, continue monitoring the specific metric for the two subsequent measurement periods. If the metric returns to target range, the diagnosis was correct and the intervention worked. If the metric remains below target, the diagnosis may have been incomplete and further investigation is required.
The Monthly Management Review Template
Once per month, calculate every metric in this guide and complete the following review:
Reproductive metrics review:
- PSY (current month vs. target vs. prior month): above/below/trending up/down
- Farrowing rate: above/below target
- Pre-weaning mortality: above/below target; if above, which cause dominates?
- WEI: above/below target
- Any sow with 2+ consecutive below-target cycles: flag for individual assessment
Production metrics review:
- FCR (most recently completed cohort): above/below target
- Days to market (most recently sold batch): above/below target
- Grower-finisher mortality: above/below target
Financial metrics review:
- Feed cost as % of revenue: above/below target; what drove it?
- Net margin: above/below target; which specific cost or revenue change drove the deviation?
- Cash position: adequate for next 30 days’ planned expenditure?
Decisions made this month:
- List the specific management decisions made in response to metric review
- List the target metric improvement expected from each decision
- List the review date for each decision’s effectiveness assessment
Records Technology — Paper vs. Digital Systems
When Paper Is Adequate
For farms below approximately 50 sows, well-designed paper records forms with monthly manual metric calculation are adequate and practical. The implementation friction of adopting software that staff are unfamiliar with often exceeds the benefit at smaller scale — inconsistently used digital systems are no better than inconsistently used paper systems.
Requirements for effective paper records:
- Standardized forms pre-printed and consistently available at the recording point (not reconstructed from memory later in the office)
- A designated calculation day once per month when all metric calculations are completed
- A physical folder or binder organized by record type and month, stored where it can be found and referenced
When Digital Systems Add Value
For farms above 50 sows, or for farms where the owner/manager is not on-site daily (requiring remote metric visibility), digital systems add meaningful value:
Simple spreadsheet systems (Google Sheets, Excel):
- Pre-built data entry forms that automatically calculate metrics from entries
- Accessible from any device with internet connection (allowing remote monitoring)
- Basic charting to visualize metric trends across months
- Shareable with advisors, investors, or lenders without physical record transport
Dedicated farm management software:
- Available in various configurations from international providers (some with African market distribution)
- More sophisticated analysis capability (parity-by-parity sow performance, cohort tracking, financial integration)
- Higher implementation cost and training requirement — justified at larger scale or for operations with specific reporting obligations to investors or lenders
The key selection criterion for any records technology: Will the specific people who need to enter data actually use it consistently? A sophisticated system that stockpersons find intimidating and avoid is less valuable than a simple paper form they complete reliably every day.
The Records System Startup — Getting It Right From Day One
Why Establishing Records From the First Day Matters
A farm that begins keeping records from day one has, by the end of the first production cycle, exactly the baseline data it needs to detect the performance deviations that the second production cycle will inevitably produce. A farm that begins keeping records in month 8 because “the first few months were chaotic” has no baseline against which to assess whether month 9 is performing better or worse — the chaos of the startup period is precisely when establishing records discipline is most valuable as a management stabilizer.
The startup records checklist (first week of operations):
- Individual sow cards created for every gilt entered quarantine
- Farrowing record forms printed and stored in the farrowing house where they will be used
- Pen record forms created for each pen in the facility
- Feed delivery recording system established and communicated to whoever receives deliveries
- Treatment log established in the farm medicine cabinet where medications are stored
- Breeding register created with all quarantine gilts entered
The first monthly metric review:
After the first full month of operation (even if production is not yet fully underway), calculate and record every metric for which data is available. Many metrics will be zero or not yet calculable — but the discipline of calculating them, documenting what is and is not yet calculable, and reviewing the first month’s financial position establishes the habit that will make the metric review genuinely valuable when steady-state production data starts flowing.
Summary
A commercial pig farm’s records system is not an administrative burden added on top of the operational work of running the farm — it is the management tool that makes the operational work purposeful. Without records, each production cycle is evaluated by impression: “the pigs seemed to grow well” or “we had some losses but not too many.” With records, each cycle is evaluated by measurement: PSY 19.3 (below target 22), pre-weaning mortality 12.8% (above target 10%), FCR 2.72 (above target 2.60), WEI 7.4 days (above target 6 days).
The second of these evaluations is not more work than the first. It is the same work — observing what happened — translated into numbers that can be compared against targets, trended over time, and used to make the specific management decisions that move the numbers toward their targets.
The metrics in this guide — PSY, farrowing rate, litter size, pre-weaning mortality, WEI, FCR, ADG, feed cost per pig, net margin — collectively describe everything that matters in commercial pig production in numerical terms. Tracking them monthly, reviewing them systematically, and responding to deviations with specific, targeted management interventions is the discipline that separates operations that improve year over year from those that repeat the same performance level — or the same underperformance — indefinitely.
Measure it. Calculate it. Review it. Act on it. In that sequence, records management transforms from an obligation into the highest-return management activity on the farm.