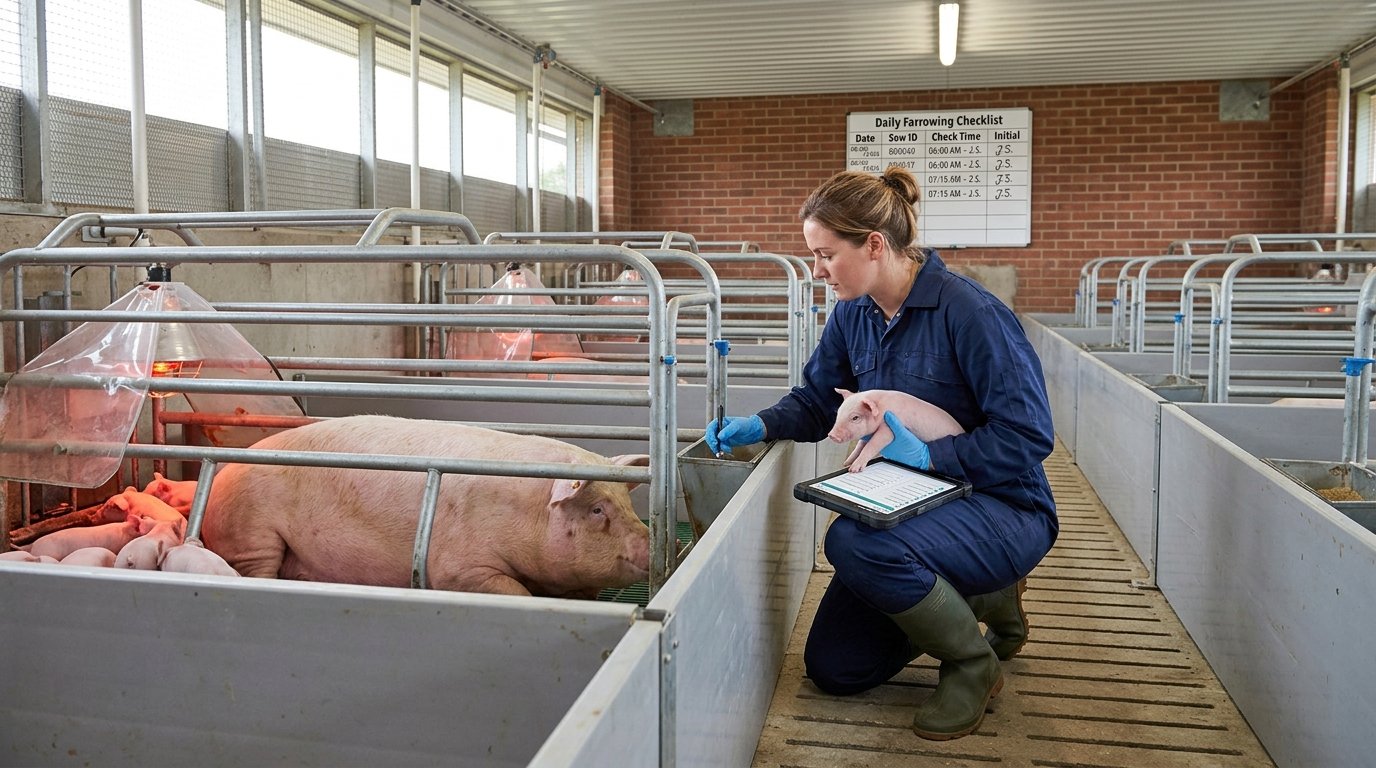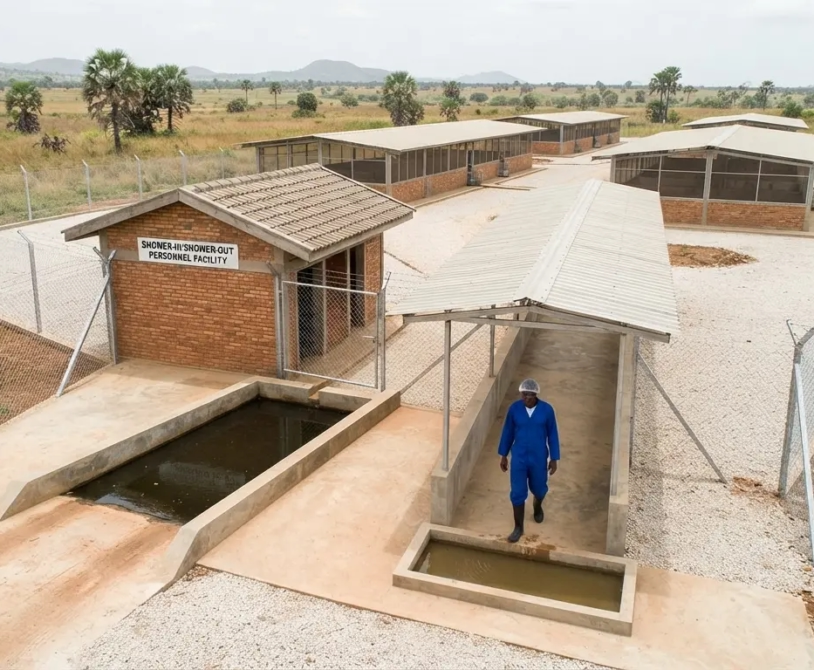
Total farm profit is a lagging indicator — it tells an operator whether the year was profitable only after it’s over. Cost per kilogram of pork produced is a leading indicator: it can be calculated mid-cycle, compared directly against market price, and tracked batch-to-batch to catch a cost drift before it erodes a full year’s margin. Two farms producing the same number of pigs can have very different profitability depending on this single number, which is why it is the core metric used in the break-even and sensitivity analysis throughout this series.
The Core Formula
Cost per kg=Total Kilograms Produced/Total Production Cost
The formula is simple; the difficulty is entirely in what belongs in each term. Most cost-per-kg errors come from an incomplete numerator (leaving out depreciation, breeding stock replacement, or labor) or an inconsistent denominator (mixing live weight and carcass weight without adjusting for yield).
What Belongs in “Total Production Cost”
| Cost Component | Included? | Notes |
|---|---|---|
| Feed | Yes | Typically 60–75% of total cost — see feed cost tables elsewhere in this series |
| Labor | Yes | Direct production labor; exclude non-production admin roles if calculating a pure production cost |
| Veterinary and health | Yes | Vaccines, medication, diagnostics, consultation fees |
| Utilities | Yes | Electricity, water, fuel |
| Maintenance | Yes | Building and equipment upkeep |
| Breeding stock replacement | Yes | Annual gilt/boar turnover cost, often omitted in error |
| Depreciation | Yes, for full economic cost | Infrastructure and equipment depreciation; omit only if calculating a strict cash-cost figure for short-term pricing decisions |
| Administrative overhead | Yes | Insurance, licenses, accounting |
| Interest/debt service | Context-dependent | Include for equity return analysis; exclude for pure production cost benchmarking against industry figures |
A cost-per-kg figure that excludes depreciation and breeding stock replacement will understate true cost by 8–12% at typical commercial scale — enough to make a marginal operation look falsely profitable on paper.
What Belongs in “Total Kilograms Produced” — and Why This Is Where Most Errors Happen
The denominator must match the stage of production the cost figures cover, and the three common measurement points give materially different results for the same farm.
| Measurement Point | Definition | Typical Yield from Live Weight |
|---|---|---|
| Live weight | Weight of the pig at farm gate, before transport/slaughter | 100% (baseline) |
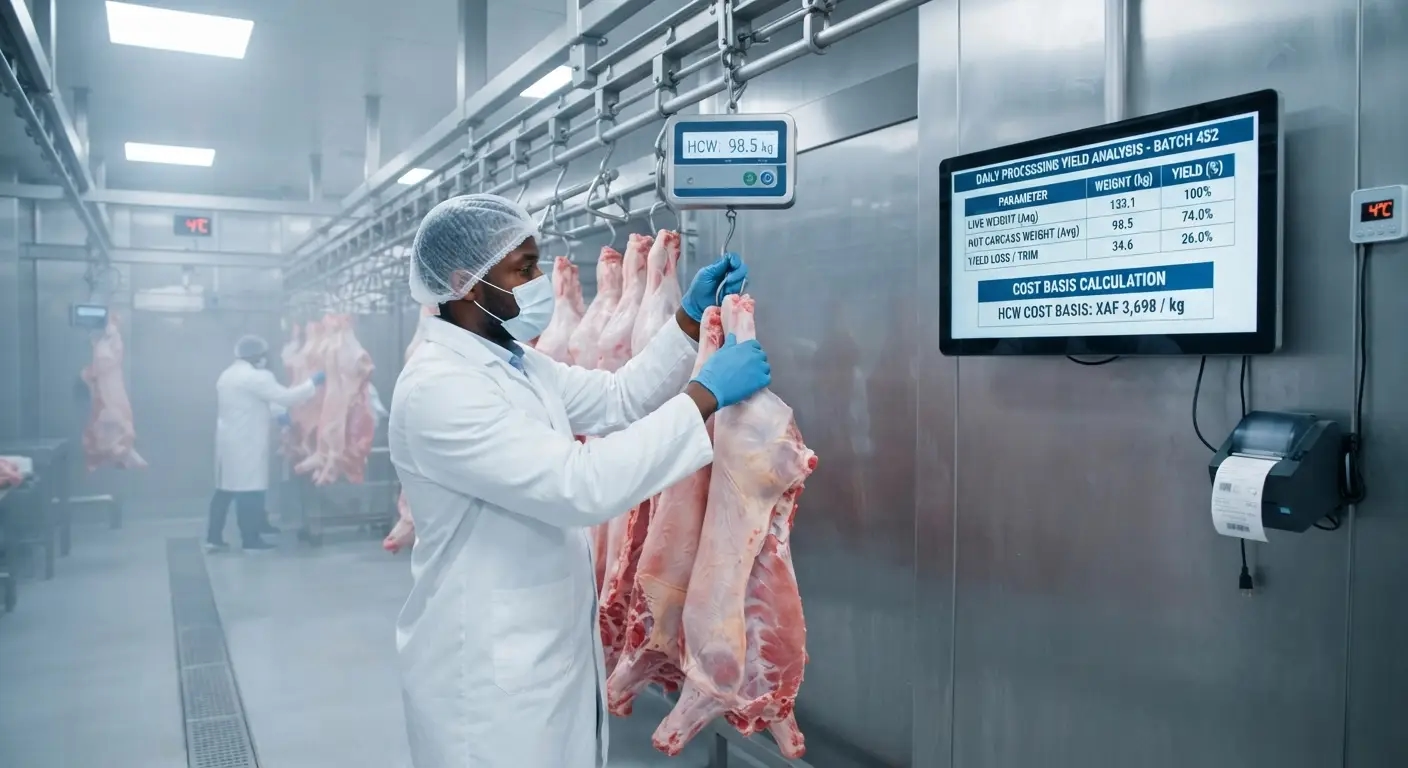
| Hot carcass weight | Weight immediately after slaughter and dressing | 72–76% of live weight |
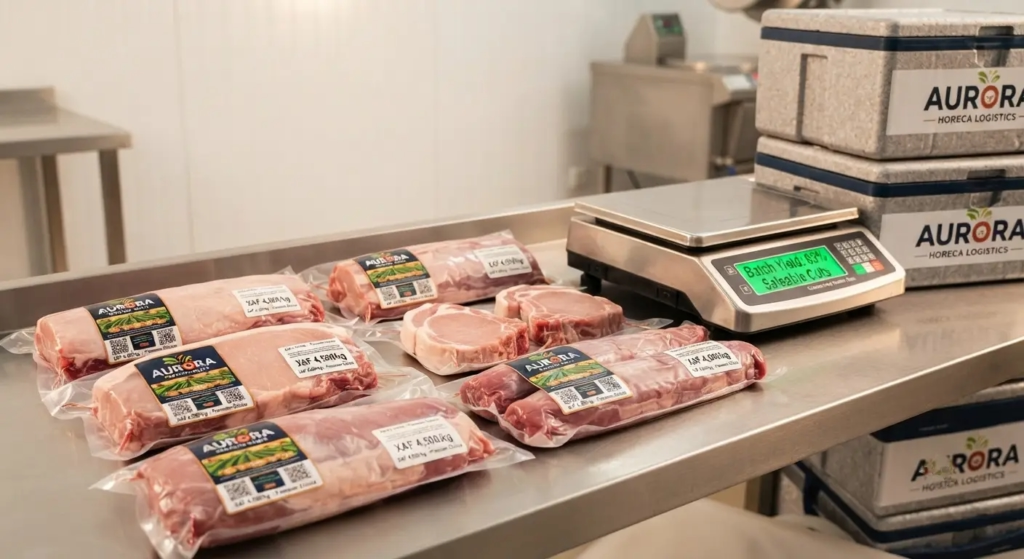
| Saleable/deboned cuts | Weight of processed, ready-to-sell product | 62–68% of live weight |
Using the wrong denominator produces cost-per-kg figures that are not comparable to each other. A cost calculated per kg live weight will look substantially lower than the identical farm’s cost per kg of saleable cuts — not because the farm is more efficient, but because the denominator shrank while the numerator stayed the same. Always state which measurement point a cost-per-kg figure uses before comparing it to a benchmark or another farm’s figure.
Worked Example — 50-Sow Farrow-to-Finish Operation (Year 3 Steady State)
Using the OpEx and production figures consistent with the business plan model used throughout this series:
| Input | Value |
|---|---|
| Market pigs produced | 1,100 |
| Average market weight (live) | 100 kg |
| Total live weight produced | 110,000 kg |
| Total annual OpEx (excl. depreciation) | XAF 286,757,500 |
| Annual depreciation | XAF 14,214,286 |
| Total production cost | XAF 300,971,786 |
Cost per Kilogram — Live Weight
110,000300,971,786=XAF 2,736 per kg live weight
Cost per Kilogram — Hot Carcass Weight (74% yield)
Total carcass kg=110,000×0.74=81,400 kg 81,400300,971,786=XAF 3,698 per kg carcass weight
Cost per Kilogram — Saleable Deboned Cuts (65% yield)
Total saleable kg=110,000×0.65=71,500 kg 71,500300,971,786=XAF 4,209 per kg saleable product
The same farm, the same year, the same total cost — but the reported cost per kg ranges from XAF 2,736 to XAF 4,209 depending on which weight measure is used. This is why every cost-per-kg figure in a business plan, loan application, or benchmarking report must specify its measurement basis explicitly.
Comparing Cost per Kilogram to Market Price
Cost per kg is only useful when set directly against the price the farm actually realizes, by channel:
| Channel | Sale Price (per kg) | Relevant Cost Basis | Margin per kg |
|---|---|---|---|
| Commodity/wholesale (live weight) | XAF 1,700 | XAF 2,736 (live weight) | –1,036 (loss) |
| Premium/HORECA (saleable cuts) | XAF 4,500 | XAF 4,209 (saleable cuts) | +291 (profit) |
This mirrors the finding in the piggery business plan model elsewhere in this series: pure commodity-channel sales at live weight do not cover full production cost at this scale, while premium-channel sales of processed cuts clear cost with a positive, if narrow, margin. Cost-per-kg analysis is what makes this gap visible in a way that whole-farm profit figures can obscure — a farm selling half its volume at a loss can still show an annual profit if the other half is priced well enough, but the loss-making channel remains a structural risk.
Sensitivity — What Moves Cost per Kilogram Most
| Variable | Change | Effect on Cost per kg (Live Weight) |
|---|---|---|
| Feed cost | +10% | +XAF 205/kg |
| FCR (grower-finisher) | Worsens from 2.60 to 2.80 | +XAF 178/kg |
| PSY | Falls from 22 to 18 | +XAF 480/kg (fewer pigs absorb same fixed cost) |
| Pre-weaning mortality | Rises from 10% to 15% | +XAF 165/kg |
| Labor cost | +15% (wage increase) | +XAF 34/kg |
Feed cost and FCR are the two levers with the largest direct effect on cost per kg, but PSY has the largest indirect effect — because fixed costs (labor, depreciation, utilities, administration) are spread across fewer pigs when reproductive performance falls, inflating the cost per kg of every pig produced, not just the ones lost. This is the same dynamic behind the operating-leverage argument in the scalability guidance elsewhere in this series: production efficiency and herd scale both work by spreading fixed costs over more output.
Benchmarking Cost per Kilogram
| Performance Tier | Approximate Cost per kg (Live Weight) | Typical Drivers |
|---|---|---|
| Underperforming | XAF 2,900–3,300+ | Low PSY, high mortality, purchased (non-mixed) feed |
| Average commercial | XAF 2,500–2,900 | Standard phase-feeding, moderate FCR |
| Efficient commercial | XAF 2,100–2,500 | On-farm feed mixing, strong FCR, PSY 22+ |
| Highly optimized | Below XAF 2,100 | Scale efficiencies, genetics investment, minimal mortality |
An operation tracking consistently above XAF 2,900/kg live weight should treat this as a diagnostic signal to review feed sourcing, FCR, and reproductive performance — in that order, since feed and FCR typically offer the fastest correction path.
Calculating Cost per Kilogram in Practice — A Monthly Tracking Template
| Data Point | Source | Frequency |
|---|---|---|
| Feed consumed (kg) and cost | Feed mixer/storage records | Weekly |
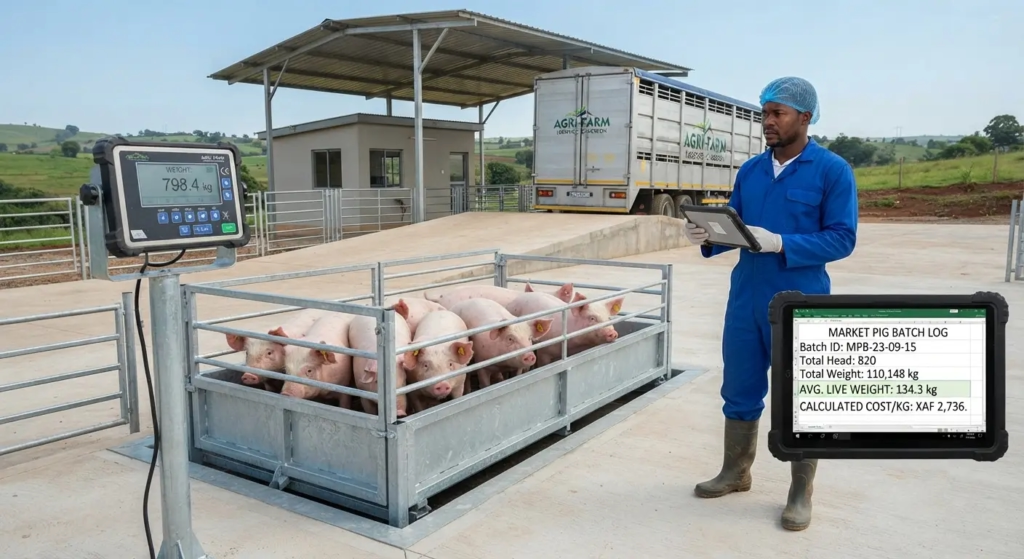
| Total kg produced (by batch, live weight at sale) | Weighbridge/scale records | Per batch |
| Labor cost allocation | Payroll records | Monthly |
| Veterinary and health spend | Invoices/treatment log | Monthly |
| Depreciation | Fixed asset schedule | Annual, allocated monthly |
| Mortality (affects effective kg produced per input cost) | Mortality log | Weekly |
Calculating cost per kg monthly, rather than only at year-end, allows a farm manager to catch a feed cost spike or FCR drift within weeks rather than discovering it in an annual reconciliation — consistent with the monthly financial reconciliation task in the labor management checklists elsewhere in this series.
Summary
Cost per kilogram of pork is the single number that connects daily production decisions to farm profitability, but it is only meaningful when its measurement basis — live weight, carcass weight, or saleable cuts — is stated explicitly and matched consistently against the price of the channel it’s compared to. At the 50-sow model used throughout this series, cost per kg ranges from roughly XAF 2,736 (live weight) to XAF 4,209 (saleable cuts), and comparing either figure to the wrong channel price produces a misleading profitability picture. Feed cost and FCR move this number fastest in the short term; PSY moves it most severely over time, because reproductive underperformance spreads the same fixed cost base across fewer pigs. Tracking cost per kg monthly, by batch, is what turns this from a year-end diagnosis into a tool for catching cost drift while it can still be corrected.