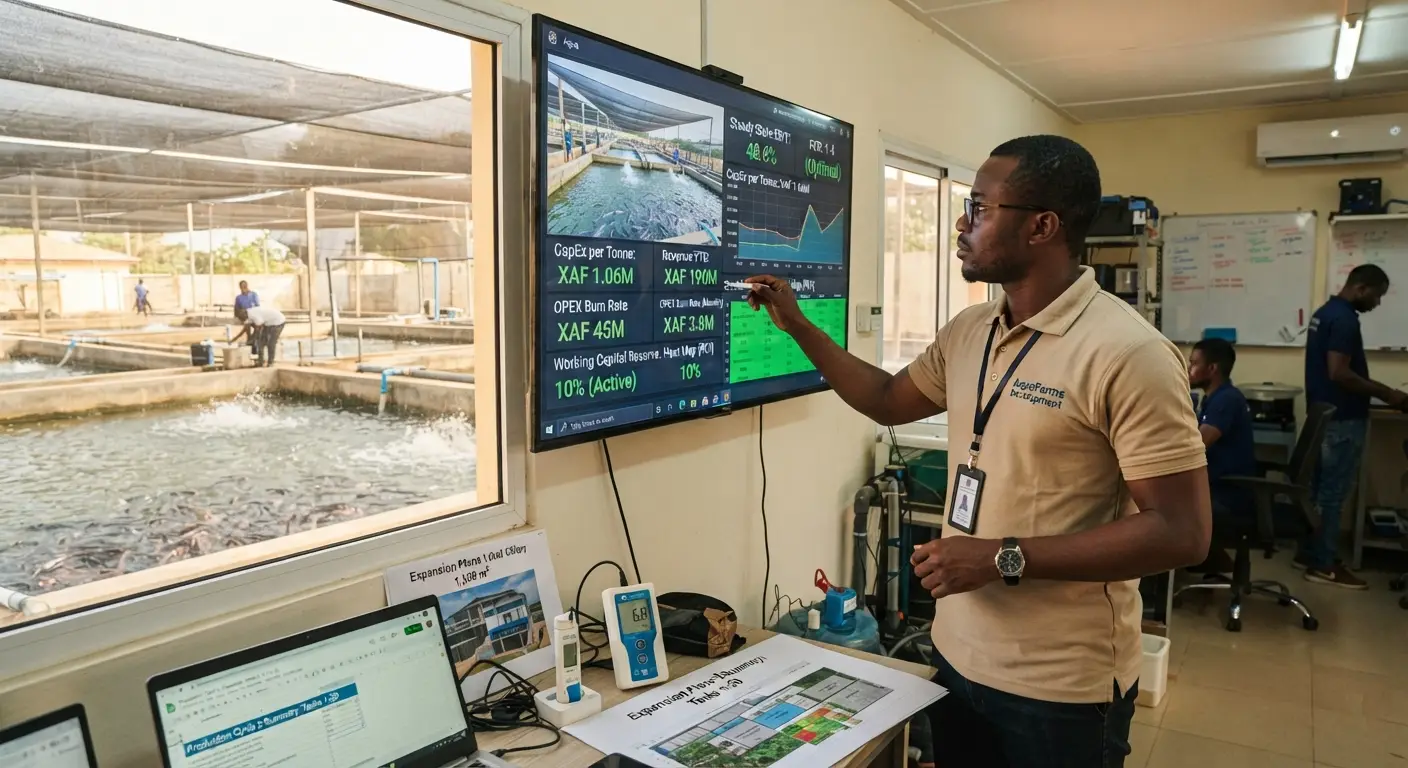
More catfish farming enterprises fail due to inadequate financial planning than to inadequate technical knowledge. The technical information required to raise African catfish commercially is widely available — the biology, the water quality requirements, the feeding protocols, the disease management approaches. What is significantly less available, and what determines whether a technically competent operation is also a financially viable one, is the honest financial modeling that answers the questions every investor and operator must answer before committing capital: How much does it actually cost to build and equip a commercial catfish farm? What are the realistic ongoing operating costs? What revenue can be generated from what level of production? When does the operation break even? And what return on the invested capital can a well-managed operation realistically expect?
This business plan provides those numbers — based on the operational realities of commercial catfish farming in West and Central Africa rather than on the optimistic projections that characterize most aquaculture investment promotion materials. The projections here are conservative where conservatism is appropriate (startup production performance is discounted from steady-state targets), explicit about the assumptions that underlie each number (so that investors with different cost or price assumptions can substitute their own figures), and honest about the primary financial risks that can convert a projected profit into an actual loss.
The analysis is structured around two reference farm scales — a 500 m³ concrete tank operation (a viable commercial entry point for most entrepreneurs) and a 1,500 m³ operation (a scale at which meaningful operating leverage and market positioning advantages emerge) — with comparative financial projections for both scales that illustrate the economics of growth.
Business Overview and Production Model
The Reference Production System
Production species: Clarias gariepinus (African catfish) — as established in the species comparison article, the unambiguous choice for West and Central African commercial production given its growth rate, market demand, and climate alignment.
Production system: Concrete tank grow-out (the dominant commercial system in the region’s peri-urban and urban production zones) — chosen over earthen ponds for land efficiency, management precision, and the operational control that supports the consistent quality required for premium market access.
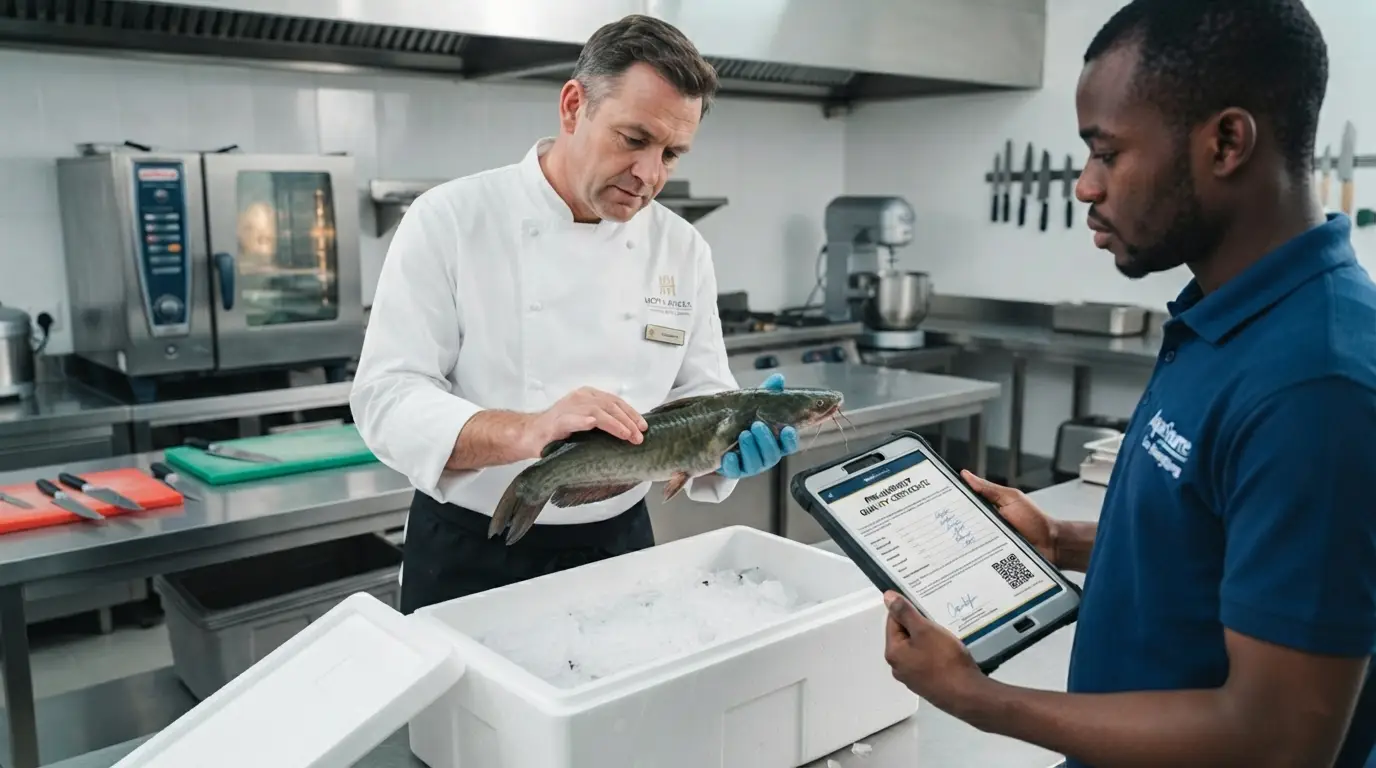
Market positioning: Mixed channel — primary sales to institutional buyers (hotels, restaurants, food service) at premium pricing for 60% of production, with commodity wholesale as the secondary channel for 40% — the market mix that the profitability analysis in the previous business plan articles established as required for sustainable commercial operation.
Production model assumptions:
| Parameter | Conservative | Target | Notes |
|---|---|---|---|
| FCR | 1.5 | 1.4 | Target achievable with floating feed and disciplined feeding management |
| PSY equivalent (cycles/year) | 2.0 | 2.2 | Two complete production cycles per tank per year; partial third cycle in some tanks |
| Fingerling stocking weight | 10 g | 10 g | — |
| Target harvest weight | 900 g | 1,000 g | Consumer preference range in major West African urban markets |
| Grow-out duration | 20 weeks | 18 weeks | Temperature- and management-dependent |
| Survival rate (stocking to harvest) | 88% | 92% | Higher survival in well-managed concrete tank systems |
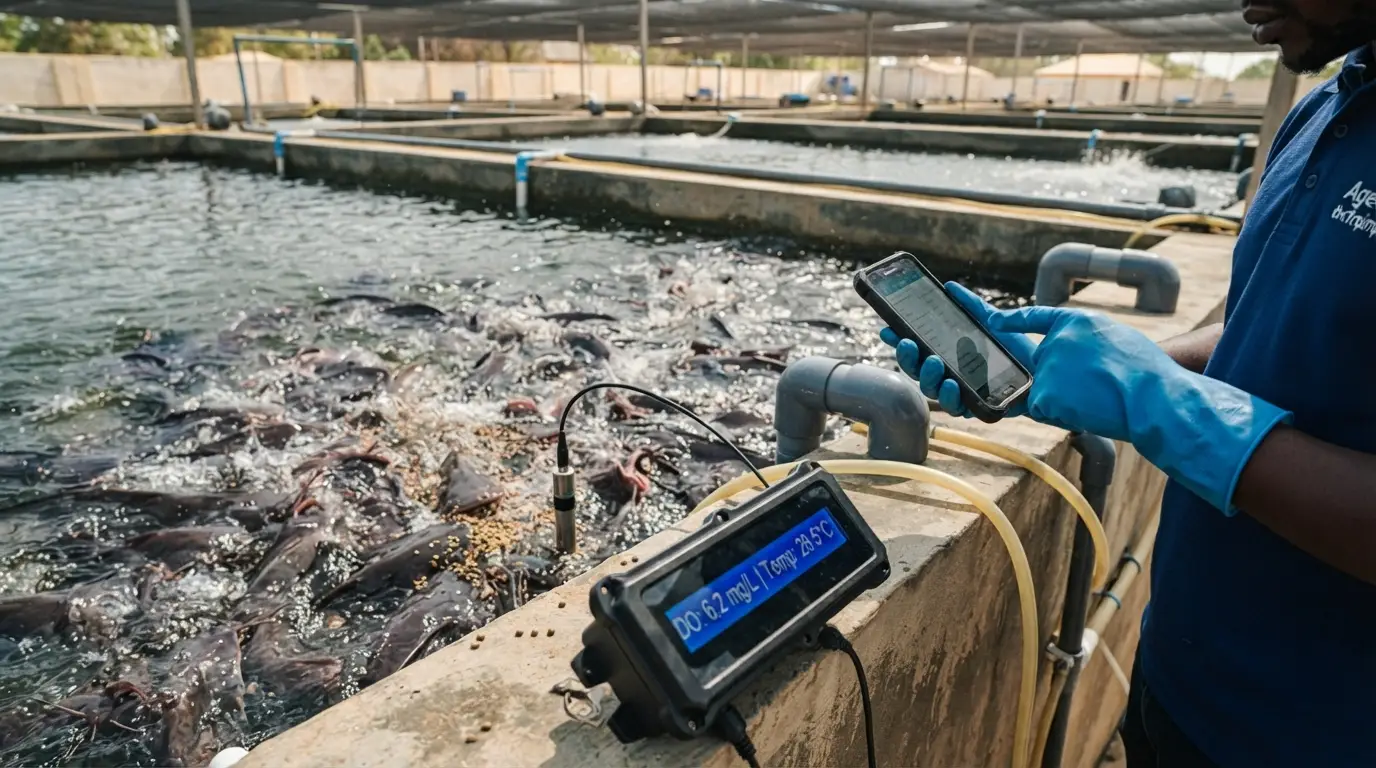
| Feed crude protein | 40% | 40% | Commercial extruded floating pellet |
Capital Investment (CapEx)
Scale 1: 500 m³ Concrete Tank Operation
The 500 m³ operation represents the minimum viable scale for commercial market positioning — large enough to supply institutional buyers with consistent volume, but achievable as a first commercial investment for most entrepreneurs without institutional financing.
Tank infrastructure (10 tanks × 50 m³ each):
| Item | Specification | Cost (XAF) | Cost (USD) |
|---|---|---|---|
| Concrete tank construction (10 tanks) | 50 m³ each, 5m × 5m × 2m, walls + floor | 30,000,000 | 50,000 |
| Plumbing (inlet, outlet, standpipes, drainage) | Per tank: inlet valve, standpipe, drain | 4,000,000 | 6,667 |
| Aeration system (10 blowers + diffusers) | 1 blower per 2 tanks, diffusers throughout | 5,000,000 | 8,333 |
| Shade structure (over all tanks) | Steel frame + shade cloth, 50% shade | 4,500,000 | 7,500 |
| Subtotal — Tank infrastructure | 43,500,000 | 72,500 |
Water supply and distribution:
| Item | Cost (XAF) | Cost (USD) |
|---|---|---|
| Borehole drilling and casing (100m depth) | 5,000,000 | 8,333 |
| Submersible pump + motor | 1,500,000 | 2,500 |
| Header tank (10,000 liter elevated) | 1,800,000 | 3,000 |
| Distribution pipework (PVC, all tanks) | 1,200,000 | 2,000 |
| Subtotal — Water supply | 9,500,000 |
Support infrastructure:
| Item | Cost (XAF) | Cost (USD) |
|---|---|---|
| Perimeter fence (400m perimeter) | 3,500,000 | 5,833 |
| Feed storage building (50 m²) | 2,000,000 | 3,333 |
| Staff facilities (office, changing room) | 1,500,000 | 2,500 |
| Quarantine facility (2 tanks, 10 m³ each) | 3,000,000 | 5,000 |
| Generator (20 kVA diesel backup) | 3,500,000 | 5,833 |
| Electrical installation | 1,500,000 | 2,500 |
| Subtotal — Support infrastructure | 15,000,000 |
Equipment:
| Item | Cost (XAF) | Cost (USD) |
|---|---|---|
| DO meter (2 units + spare probes) | 500,000 | 833 |
| pH meter (1 unit) | 200,000 | 333 |
| Platform scale (200 kg capacity) | 400,000 | 667 |
| Harvest nets, grading equipment, buckets | 600,000 | 1,000 |
| Live transport drums (10 × 200L) | 500,000 | 833 |
| Feed storage bins (sealed, rodent-proof) | 300,000 | 500 |
| First aid and treatment kit | 200,000 | 333 |
| Motorbike (farm operations and delivery) | 900,000 | 1,500 |
| Subtotal — Equipment | 3,600,000 |
Pre-operating costs:
| Item | Cost (XAF) | Cost (USD) |
|---|---|---|
| Business registration and licenses | 300,000 | 500 |
| Farm design and technical consultancy | 800,000 | 1,333 |
| Staff recruitment and training | 500,000 | 833 |
| Initial fingerling purchase (first stocking) | 1,500,000 | 2,500 |
| Subtotal — Pre-operating | 3,100,000 |
Total CapEx — 500 m³ Operation:
| Category | XAF | USD | % of Total |
|---|---|---|---|
| Tank infrastructure | 43,500,000 | 72,500 | 60.7% |
| Water supply | 9,500,000 | 15,833 | 13.2% |
| Support infrastructure | 15,000,000 | 25,000 | 20.9% |
| Equipment | 3,600,000 | 6,000 | 5.0% |
| Pre-operating | 3,100,000 | 5,167 | 4.3% |
| Contingency (8%) | 5,976,000 | 9,960 | — |
| TOTAL CAPEX | 80,676,000 | 134,460 | — |
Scale 2: 1,500 m³ Concrete Tank Operation
At 3× the tank volume, the 1,500 m³ operation does not scale linearly in capital cost — shared infrastructure (borehole, perimeter fence, office) does not triple with tank volume, creating meaningful capital efficiency at larger scale.
Total CapEx — 1,500 m³ Operation (summary):
| Category | XAF | USD |
|---|---|---|
| Tank infrastructure (30 tanks × 50 m³) | 110,000,000 | 183,333 |
| Water supply (larger pump, expanded distribution) | 15,000,000 | 25,000 |
| Support infrastructure (shared costs + expanded) | 22,000,000 | 36,667 |
| Equipment (larger scale) | 7,000,000 | 11,667 |
| Pre-operating | 4,000,000 | 6,667 |
| Contingency (8%) | 12,640,000 | 21,067 |
| TOTAL CAPEX | 170,640,000 | 284,400 |
Capital efficiency comparison:
| Scale | Total CapEx | CapEx per m³ of production capacity |
|---|---|---|
| 500 m³ | XAF 80,676,000 | XAF 161,352/m³ |
| 1,500 m³ | XAF 170,640,000 | XAF 113,760/m³ |
The 1,500 m³ operation costs 29.5% less per m³ of capacity — illustrating the capital efficiency benefit of scale that makes larger operations financially more attractive per unit of production capacity despite their higher absolute investment requirement.
Operating Expenditure (OpEx)
Annual OpEx — 500 m³ Operation (Steady State, Year 2–3)
Feed costs (the dominant operating cost at 60–70% of total OpEx):
Production calculation at steady state:
- Tank volume: 500 m³
- Stocking density: 80 fish/m³ at 10 g = 40,000 fish
- Survival to harvest (90%): 36,000 fish at 1,000 g = 36,000 kg per cycle
- Cycles per year: 2.1 (accounting for tank cleanout between cycles)
- Annual production: 36,000 × 2.1 = 75,600 kg live weight per year
- Feed required (FCR 1.4): 75,600 × 1.4 = 105,840 kg feed per year
- Feed cost (XAF 600/kg commercial extruded): XAF 63,504,000
Labor:
| Position | Number | Annual Salary (XAF) | Total (XAF) |
|---|---|---|---|
| Farm manager (experienced) | 1 | 6,000,000 | 6,000,000 |
| Fish farm technician (water quality, feeding) | 2 | 3,000,000 | 6,000,000 |
| General farm worker (cleaning, harvest labor) | 1 | 2,000,000 | 2,000,000 |
| Security guard | 1 | 1,800,000 | 1,800,000 |
| Total labor | 15,800,000 |
Fingerling purchase:
- Annual fingerling requirement: 40,000 fish/cycle × 2.1 cycles = 84,000 fingerlings/year
- Fingerling cost (XAF 80 per 10 g fingerling): XAF 6,720,000
Utilities:
| Item | Annual Cost (XAF) | Notes |
|---|---|---|
| Electricity (aeration, lighting) | 2,400,000 | Grid power where available |
| Generator fuel (backup, 20% of operation time) | 1,800,000 | — |
| Water (pump electricity) | 600,000 | — |
| Total utilities | 4,800,000 | — |
Health and veterinary:
| Item | Annual Cost (XAF) |
|---|---|
| Routine medicines and treatments | 800,000 |
| Diagnostic testing (water quality reagents, microscopy) | 400,000 |
| Veterinary consultation | 600,000 |
| Total health | 1,800,000 |
Maintenance and repairs:
| Item | Annual Cost (XAF) |
|---|---|
| Tank and infrastructure maintenance | 1,200,000 |
| Equipment maintenance and replacement | 600,000 |
| Vehicle/motorbike maintenance | 400,000 |
| Total maintenance | 2,200,000 |
Administrative and other:
| Item | Annual Cost (XAF) |
|---|---|
| Transport (market delivery, input collection) | 1,200,000 |
| Administrative (licenses, communications, accounting) | 800,000 |
| Insurance (property and stock) | 1,500,000 |
| Total administrative | 3,500,000 |
Depreciation:
| Asset Category | Value (XAF) | Life (years) | Annual Depreciation (XAF) |
|---|---|---|---|
| Tank infrastructure | 43,500,000 | 20 | 2,175,000 |
| Water supply infrastructure | 9,500,000 | 15 | 633,333 |
| Support infrastructure | 15,000,000 | 20 | 750,000 |
| Equipment | 3,600,000 | 5 | 720,000 |
| Total depreciation | 4,278,333 |
Annual OpEx Summary — 500 m³ Operation:
| Category | Annual Cost (XAF) | Annual Cost (USD) | % of Total OpEx |
|---|---|---|---|
| Feed | 63,504,000 | 105,840 | 63.4% |
| Labor | 15,800,000 | 26,333 | 15.8% |
| Fingerlings | 6,720,000 | 11,200 | 6.7% |
| Utilities | 4,800,000 | 8,000 | 4.8% |
| Health and veterinary | 1,800,000 | 3,000 | 1.8% |
| Maintenance | 2,200,000 | 3,667 | 2.2% |
| Administrative | 3,500,000 | 5,833 | 3.5% |
| Depreciation | 4,278,333 | 7,131 | 4.3% |
| TOTAL OpEx | 102,602,333 | 171,004 | 100% |
Cost per kilogram of fish produced (500 m³ operation):
Total OpEx ÷ Annual production = XAF 102,602,333 ÷ 75,600 kg = XAF 1,357 per kg
Revenue Projections
Pricing Assumptions
Market channel mix (as established for viable commercial operation):
| Channel | Volume Share | Price (XAF/kg live weight) | Notes |
|---|---|---|---|
| Premium institutional (hotels, restaurants) | 60% | 3,200 | Consistent supply relationship required |
| Commodity wholesale | 40% | 1,800 | Live fish, direct to market or wholesale buyer |
| Weighted average price | 2,640 |
Revenue Projection — 500 m³ Operation (Annual, Steady State)
| Item | Calculation | Value (XAF) |
|---|---|---|
| Annual production (live weight) | 75,600 kg | — |
| Premium channel volume (60%) | 45,360 kg × XAF 3,200 | 145,152,000 |
| Commodity channel volume (40%) | 30,240 kg × XAF 1,800 | 54,432,000 |
| Gross revenue | 199,584,000 | |
| Revenue per kg | XAF 2,640 |
Five-Year P&L Projection — 500 m³ Operation
| Year 1 | Year 2 | Year 3 | Year 4 | Year 5 | |
|---|---|---|---|---|---|
| Production capacity utilization | 60% | 85% | 100% | 100% | 100% |
| Annual production (kg) | 45,360 | 64,260 | 75,600 | 75,600 | 75,600 |
| Gross Revenue (XAF) | 119,750,400 | 169,646,400 | 199,584,000 | 199,584,000 | 204,573,600* |
| Feed cost | 38,102,400 | 53,978,400 | 63,504,000 | 63,504,000 | 63,504,000 |
| Labor | 15,800,000 | 15,800,000 | 15,800,000 | 15,800,000 | 16,200,000 |
| Fingerlings | 4,032,000 | 5,712,000 | 6,720,000 | 6,720,000 | 6,720,000 |
| Utilities | 3,500,000 | 4,200,000 | 4,800,000 | 4,800,000 | 4,800,000 |
| Health | 1,400,000 | 1,600,000 | 1,800,000 | 1,800,000 | 1,800,000 |
| Maintenance | 1,500,000 | 1,900,000 | 2,200,000 | 2,400,000 | 2,600,000 |
| Administrative | 3,200,000 | 3,400,000 | 3,500,000 | 3,500,000 | 3,500,000 |
| Depreciation | 4,278,333 | 4,278,333 | 4,278,333 | 4,278,333 | 4,278,333 |
| Total Costs | 71,812,733 | 90,868,733 | 102,602,333 | 102,802,333 | 103,402,333 |
| EBIT (Operating Profit) | 47,937,667 | 78,777,667 | 96,981,667 | 96,781,667 | 101,171,267 |
| EBIT Margin | 40.0% | 46.4% | 48.6% | 48.5% | 49.5% |
*Year 5 revenue includes a 2.5% price appreciation assumption
Year 1 performance is discounted to 60% capacity utilization — reflecting the startup period reality: market relationships being established, staff learning systems, production parameters being optimized, and the time required to reach full production cycle throughput. Farms that project Year 1 performance at steady-state levels consistently discover that the ramp-up period consumes more working capital than anticipated.
Break-Even Analysis
Break-Even Volume
At the weighted average price of XAF 2,640 per kg and total annual fixed + variable cost structure:
Fixed costs (approximately): XAF 28,000,000/year (labor, utilities, maintenance, administrative, depreciation) Variable cost per kg: XAF 93/kg feed × 1.4 FCR + XAF 89 fingerling + variable health = approximately XAF 1,000/kg variable cost
Break-even volume = Fixed costs ÷ (Price per kg − Variable cost per kg) = XAF 28,000,000 ÷ (XAF 2,640 − XAF 1,000) = XAF 28,000,000 ÷ XAF 1,640 = 17,073 kg per year
At 75,600 kg steady-state annual production, the farm operates at 4.4× break-even volume — providing substantial buffer against production shortfalls, price declines, or cost increases before the operation loses money.
Break-Even Price
At full production (75,600 kg/year), the minimum price that covers all costs:
Break-even price = Total annual cost ÷ Annual production = XAF 102,602,333 ÷ 75,600 = XAF 1,357 per kg
The weighted average market price of XAF 2,640/kg provides a 94.5% margin above break-even price — a very wide safety margin relative to most agricultural production businesses.
Sensitivity Analysis
| Scenario | Change | Annual EBIT Impact (XAF) | EBIT Margin |
|---|---|---|---|
| Base case | — | 96,981,667 | 48.6% |
| Feed cost +20% (grain price spike) | XAF 720/kg feed | -12,700,800 | 42.2% |
| FCR worsens to 1.7 | Additional 22,680 kg feed | -13,608,000 | 41.8% |
| Premium channel drops to 40% | Mix shifts to commodity | -33,264,000 | 32.0% |
| Production drops 20% (disease/management) | 60,480 kg produced | -39,916,800 | 29.8% |
| Feed cost +20% AND FCR 1.7 | Combined headwinds | -26,308,800 | 35.2% |
| All negatives simultaneously | Stress scenario | -79,780,000 | 8.6% |
Key insight from the sensitivity table: The catfish business at 500 m³ scale remains profitable under most individual stress scenarios — even a 20% production drop or a 20% feed cost spike, taken alone, leaves the business with strong positive margins. The financially threatening scenarios are combinations of multiple adverse factors simultaneously — which reinforces the risk management priority of biosecurity (preventing disease events that reduce production) and market diversification (preventing market channel concentration that makes the business vulnerable to any single buyer relationship failure).
Return on Investment Analysis
ROI Calculation Framework
For equity investors evaluating the investment:
Simple payback period (500 m³ operation):
Year 1 EBIT: XAF 47,937,667 Year 2 EBIT: XAF 78,777,667 Year 3 EBIT: XAF 96,981,667
Cumulative EBIT by end of Year 2: XAF 126,715,334
Total CapEx: XAF 80,676,000
Simple payback achieved partway through Year 2 — before the end of the second year of operation, cumulative operating profit has recovered the full capital investment. This is an exceptionally fast payback period by agricultural investment standards.
Return on invested capital (Year 3 steady state):
EBIT ÷ Total CapEx = XAF 96,981,667 ÷ XAF 80,676,000 = 120.2% annual return on invested capital
This is the pre-tax, pre-financing return on capital — the return available to an all-equity investor before tax obligations or loan service. It confirms the fundamental commercial viability of the 500 m³ catfish operation at the assumed production and market parameters.
Net Present Value (NPV) at 15% discount rate (5-year projection):
| Year | EBIT (XAF) | Discount Factor (15%) | PV of EBIT (XAF) |
|---|---|---|---|
| 1 | 47,937,667 | 0.870 | 41,705,770 |
| 2 | 78,777,667 | 0.756 | 59,555,516 |
| 3 | 96,981,667 | 0.658 | 63,813,737 |
| 4 | 96,781,667 | 0.572 | 55,359,313 |
| 5 | 101,171,267 | 0.497 | 50,282,120 |
| Total PV of EBIT | 270,716,456 | ||
| Less: Initial CapEx | (80,676,000) | ||
| NPV (5-year) | 190,040,456 |
5-year NPV of XAF 190,040,456 (USD 316,734) on an initial investment of XAF 80,676,000 (USD 134,460) represents a net present value that is 2.35× the initial capital investment — confirming exceptional investment quality at the assumed parameters.
Scale Comparison — 500 m³ vs 1,500 m³
| Metric | 500 m³ | 1,500 m³ | Scale advantage |
|---|---|---|---|
| Annual production (kg) | 75,600 | 226,800 | 3.0× |
| Total CapEx (XAF) | 80,676,000 | 170,640,000 | 2.1× CapEx for 3× production |
| Annual EBIT (Year 3, XAF) | 96,981,667 | 340,000,000* | 3.5× EBIT for 2.1× CapEx |
| EBIT margin | 48.6% | 53.2%* | Operating leverage benefit |
| CapEx per tonne annual capacity | 1,067,000 | 752,000 | 29.5% more efficient per tonne |
| Simple payback | 1.7 years | 1.5 years | Faster at larger scale |
*1,500 m³ EBIT is estimated from the same cost structure with fixed cost spreading benefit applied
The financial case for the larger scale is compelling on a per-unit basis — but the absolute CapEx requirement (XAF 170,640,000 / USD 284,400) requires either significantly more personal equity or institutional financing, with the associated due diligence and loan service cost that reduces the effective return to equity.
Working Capital Requirements
Why Working Capital Is Frequently Underestimated
The most common cause of early-stage commercial catfish farm failure is not an incorrect production plan or market plan — it is underestimation of the working capital required to bridge the gap between cash outflows (daily feed cost, weekly labor cost, monthly fingerling purchase) and cash inflows (quarterly or semi-annual harvest revenue).
The cash flow gap at 500 m³ scale:
Operating cycle: 18–20 weeks from stocking to first harvest Daily cash outflow during the production cycle: feed (XAF 174,000/day) + labor (XAF 43,000/day) + utilities (XAF 13,000/day) = approximately XAF 230,000/day
From stocking to first harvest cash receipt: 20 weeks = 140 days
Working capital required to bridge the first harvest: 140 days × XAF 230,000/day = XAF 32,200,000
This working capital requirement — XAF 32 million that must be available before the first harvest generates cash — is in addition to the CapEx investment. An operation that budgets XAF 80,676,000 for construction and equipment without reserving adequate working capital discovers within the first production cycle that it cannot sustain daily operations and may be forced to harvest prematurely or at below-optimal fish weight.
Total capital required (CapEx + Working Capital):
| Component | XAF | USD |
|---|---|---|
| CapEx (500 m³) | 80,676,000 | 134,460 |
| Working capital (first cycle bridge) | 32,200,000 | 53,667 |
| Emergency reserve (10% of above) | 11,288,000 | 18,813 |
| Total capital required | 124,164,000 | 206,940 |
Part 8: Financing Structure and Risk Management
Financing Options
All-equity (self-funded):
Total capital requirement (XAF 124,164,000) funded entirely from personal savings or investor equity — no loan service cost, maximum flexibility, maximum return to equity. Requires access to significant personal capital that limits this approach to established entrepreneurs or group investment structures.
Equity + Agricultural development loan:
A common structure in Nigeria and Cameroon where agricultural development banks (Bank of Agriculture in Nigeria, Credit Foncier in Cameroon) and development finance institutions (NIRSAL, ADF, IFAD-backed programs) offer agricultural investment loans at subsidized interest rates:
Example structure:
- Equity: XAF 50,000,000 (40%)
- Agricultural development loan: XAF 74,164,000 (60%) at 9% interest, 5-year term
- Annual debt service: approximately XAF 19,400,000/year
- Year 3 EBIT after debt service: XAF 96,981,667 − XAF 19,400,000 = XAF 77,581,667
- Return on equity: XAF 77,581,667 ÷ XAF 50,000,000 = 155% annual return on equity
The leverage effect of the loan actually increases return on equity (from 120% unlevered to 155% levered) because the business generates returns well above the cost of debt — a classic positive leverage situation. The risk is that if production or market performance falls significantly below projections, loan service becomes a fixed cash obligation that must be met even in loss-making years.
Key Financial Risks and Mitigation
Risk 1: Disease event reducing production (probability: moderate; impact: high)
A significant disease outbreak causing 30–40% mortality in one or two tanks reduces annual production by 10–15%. Financial impact at 500 m³: XAF 10,000,000–15,000,000 EBIT reduction.
Mitigation: Biosecurity investment (XAF 3,500,000 CapEx + XAF 1,800,000 annual health budget from the OpEx above) reduces the probability. Insurance (included in administrative budget) provides partial financial recovery for catastrophic events. The 4.4× break-even buffer means a single production disruption does not threaten solvency.
Risk 2: Feed cost inflation (probability: high; impact: moderate)
Feed ingredients are internationally traded commodities — a 20% price spike in maize and soybean meal is a predictable periodic risk. Financial impact: XAF 12,700,800 EBIT reduction (from sensitivity analysis).
Mitigation: On-farm feed mixing capability (capital investment of approximately XAF 8,000,000 for hammer mill + pellet press, recouped within 18–24 months at 500 m³ scale) reduces feed cost per kg by 15–20% and provides ingredient substitution flexibility when specific commodity prices spike.
Risk 3: Premium market channel loss (probability: low; impact: high)
Loss of the premium institutional channel (60% of revenue at premium pricing) forces all production into commodity channels. Financial impact: EBIT drops from XAF 96,981,667 to XAF 63,717,667 — still profitable but materially lower.
Mitigation: Market diversification across multiple institutional buyers (minimum 3–4 hotel/restaurant accounts representing the premium volume) prevents single-buyer dependency. Off-flavor management (documented in the off-flavor article) and HACCP documentation protect the quality relationships that premium buyers pay premium prices to maintain.
Risk 4: Electricity/generator failure interrupting aeration (probability: moderate; impact: severe)
Power failure without backup aeration can cause mass mortality within hours in high-density concrete tank systems. Financial impact of a single tank mass mortality event: 50 m³ × 80 kg/m³ average biomass × XAF 2,640/kg = XAF 10,560,000 gross revenue loss.
Mitigation: Automatic transfer switch generator (included in CapEx), dual aeration circuits per tank, battery backup for DO alarms (included in equipment budget). These redundancy investments together cost approximately XAF 2,000,000 and protect against an event that could cost 5–10× that in a single incident.
Key Performance Indicators and Monitoring Dashboard
The Metrics That Determine Financial Performance
A catfish farm business plan is only useful if the actual performance it projects is monitored against the projections during operation. The following KPIs, tracked monthly and compared against the plan’s targets, provide early warning of performance deviation before it compounds into a financial problem:
| KPI | Target (Steady State) | Warning Threshold | Action If Below Threshold |
|---|---|---|---|
| FCR | 1.4 | Above 1.65 | Investigate feed quality, water quality, health status |
| Average daily gain (g/day) | 7–10 g/day at 500–800 g | Below 5 g/day | Water quality, feeding rate, disease investigation |
| Monthly survival rate | Above 98% | Below 96% | Disease investigation, water quality audit |
| Monthly production (kg) | 6,300 kg (75,600 ÷ 12) | Below 5,000 kg | Capacity utilization, production schedule review |
| Premium channel volume share | 60% | Below 50% | Market development activity, quality review |
| Revenue per kg | XAF 2,640 | Below XAF 2,200 | Market mix review, pricing strategy |
| Feed cost as % of revenue | 31.8% | Above 40% | FCR investigation, feed price renegotiation |
| Monthly net cash flow | Positive by Month 5 | Negative in Month 7+ | Working capital review, cost control |
Summary
The financial case for commercial African catfish farming at 500 m³ concrete tank scale in West and Central Africa is among the strongest available in the regional agricultural investment landscape:
- Low capital cost per unit of annual production capacity relative to most comparable food production investments (XAF 1,067/kg annual capacity)
- Fast payback — approximately 1.7 years from first harvest on an all-equity basis
- High operating margins — 48.6% EBIT margin at steady state, well above most food production benchmarks
- Wide break-even buffer — operating at 4.4× break-even volume provides substantial resilience against individual adverse events
- Scalability with improving economics — capital efficiency improves substantially from 500 m³ to 1,500 m³, with EBIT margin increasing from 48.6% to approximately 53%
The risks that can convert this financial profile from excellent to problematic — disease events, feed cost inflation, premium market channel disruption — are all manageable through the specific investments and management disciplines detailed across this series: biosecurity investment, on-farm feed mixing, market diversification, quality management documentation, and the operational monitoring systems that detect performance deviation early.
A catfish farming business built on the technical foundation of this series and the financial discipline this business plan articulates is not a speculative agricultural venture — it is a commercially defensible investment with documented unit economics, identifiable risks, and proven mitigation strategies. The numbers work. The management discipline to achieve them is what distinguishes successful operations from those that discover the numbers only in the financial aftermath of avoidable failures.