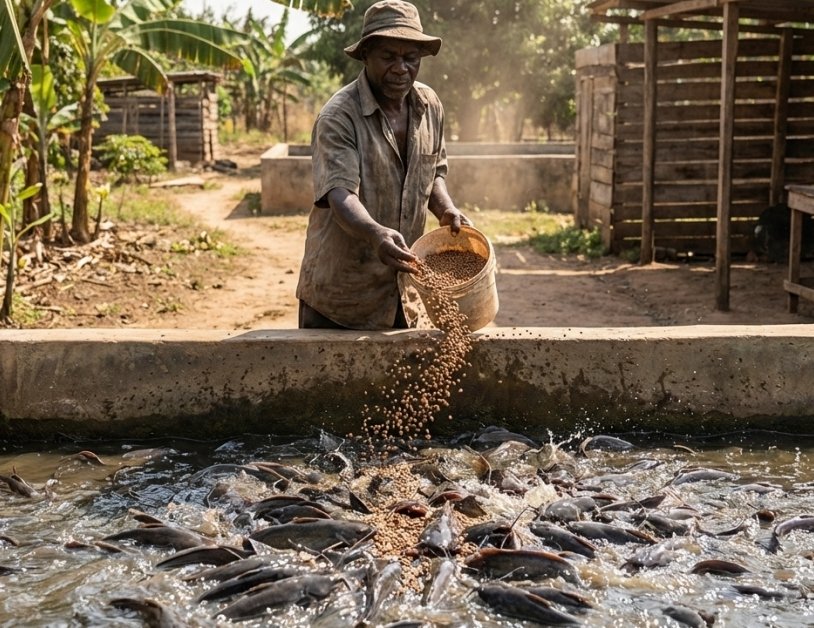
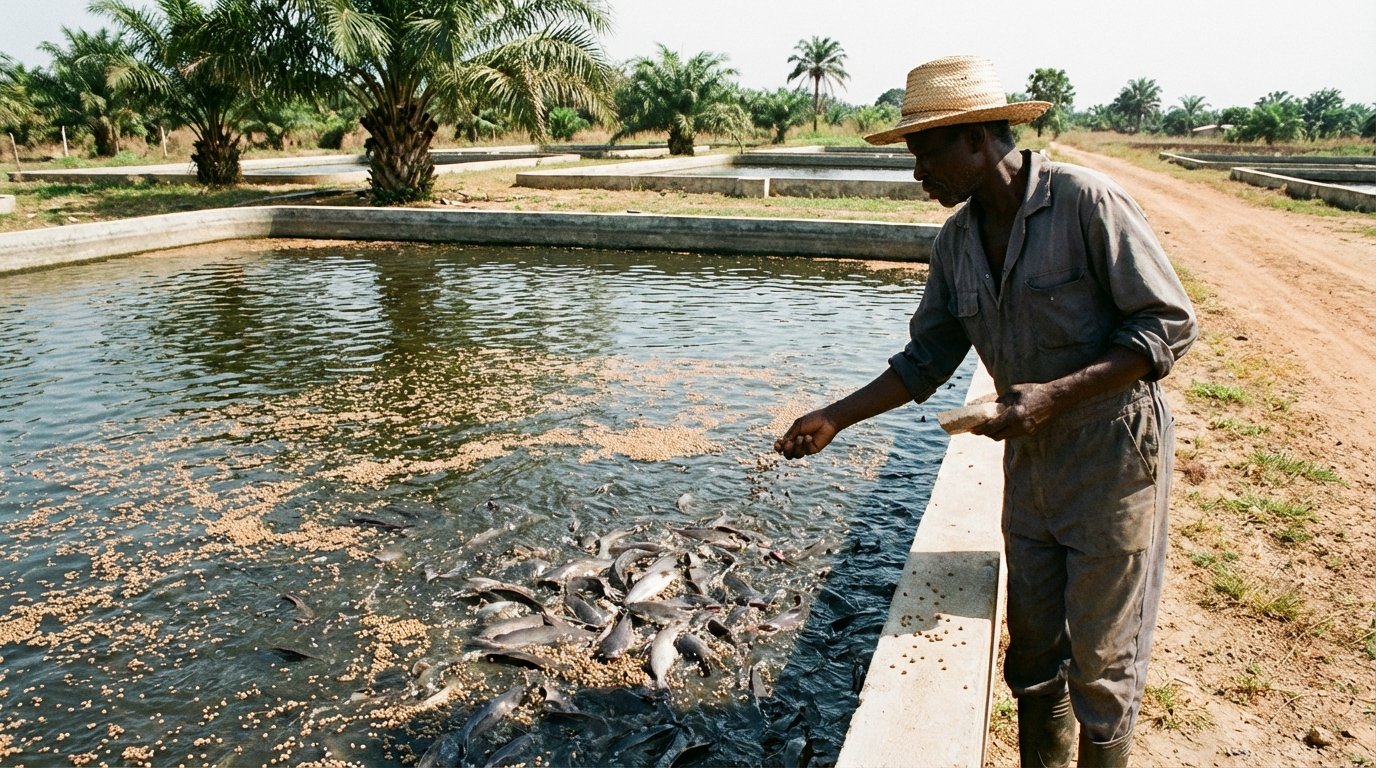
Feed is not one input among many in catfish production — it is the input, typically accounting for 60–70% of total production cost, which means the difference between a profitable pond and a loss-making one is decided more often by feeding decisions than by disease, water quality incidents, or genetics. Most catfish farms that underperform are not failing because of a single dramatic cause — they are feeding the wrong protein level for the growth stage, feeding an inconsistent daily amount, or feeding at the wrong time of day, and the cumulative effect of these small, correctable errors shows up as a feed conversion ratio (FCR) that is 20–40% worse than it should be.
Why Feed Conversion Ratio Is the Number That Matters Most
Growth rate alone is a misleading metric — a fish can grow quickly while still being fed inefficiently, if the farmer is simply feeding more to compensate for poor feed quality or poor timing. The metric that actually determines profitability is feed conversion ratio: the amount of feed required to produce one kilogram of fish weight gain. Check out our Catfish Feed Calculator to help you calculate.
FCR = Total feed fed (kg) ÷ Total weight gain (kg)
| FCR | What It Indicates |
|---|---|
| 1.0–1.3 | Excellent — achievable with high-quality floating feed, correct protein staging, and disciplined feeding practice |
| 1.4–1.6 | Acceptable commercial performance |
| 1.7–2.0 | Below target — investigate feed quality, feeding rate accuracy, or water quality |
| Above 2.0 | Poor — significant cost leakage; requires immediate diagnostic review |
A farm producing 1,000 kg of catfish at an FCR of 1.3 versus an FCR of 1.8 uses roughly 500 kg less feed to reach the same output — at a typical commercial floating feed cost, that gap alone represents a meaningful share of total production cost recovered simply through feeding discipline, with no change to stocking density or pond infrastructure.
Nutritional Requirements by Growth Stage
Catfish protein requirements decline as the fish matures, because a smaller, rapidly growing fish needs a higher concentration of protein per unit of feed to support tissue development, while a larger, slower-growing fish needs proportionally more energy (carbohydrate and fat) relative to protein.
| Growth Stage | Weight Range | Protein Requirement | Target FCR |
|---|---|---|---|
| Fingerling | 1–5 g | 40–45% | 1.0–1.2 |
| Juvenile | 5–50 g | 35–40% | 1.1–1.3 |
| Grower | 50–500 g | 28–32% | 1.3–1.5 |
| Finisher | 500 g to harvest | 25–28% | 1.4–1.7 |
Feeding a finisher-stage ration to fingerlings is a common and costly error — it starves rapidly developing fish of the protein they need. It produces a visible slowdown in early growth that is difficult to fully recover from later in the cycle, even after correcting the ration. The reverse error — feeding a high-protein fingerling ration to grower or finisher fish — wastes money without producing a proportional increase in growth, since the fish’s protein utilization efficiency declines at larger body sizes.
Feed Type: Floating vs. Sinking vs. Homemade
| Feed Type | Cost Position | Water Quality Impact | Monitoring Capability | Recommended Use |
|---|---|---|---|---|
| Floating (extruded) pellets | Highest | Best — uneaten feed is visible and can be removed before it fouls the water | High — farmer can directly observe feeding response and adjust in real time | Standard for commercial operations; the cost premium is typically recovered through better FCR and reduced water quality incidents |
| Sinking (compressed) pellets | Lower | Poorer — uneaten feed decomposes on the pond bottom, driving ammonia and oxygen depletion | Low — no way to confirm consumption without pulling samples | Earthen ponds where floating feed cost is prohibitive; requires more conservative feeding rates to offset the monitoring disadvantage |
| Homemade/on-farm formulated feed | Lowest raw cost, but inconsistent | Variable — depends entirely on formulation and ingredient quality | Low | Only appropriate where the farmer has verified, tested formulation expertise; poorly formulated homemade feed is a leading cause of the “low-quality feed” FCR problems below |
A farm switching from sinking to floating feed for the first time should expect an adjustment period — fish accustomed to feeding at the pond bottom take time to learn to feed at the surface, and feeding response should be monitored closely during the transition rather than assuming immediate full consumption.
How Much to Feed: Rate as a Percentage of Body Weight
Feeding rate should be calculated against estimated total biomass in the pond, not against a fixed daily quantity, because biomass increases continuously as fish grow — a feeding rate that was correct at stocking will significantly underfeed the pond within a few weeks unless recalculated.
| Growth Stage | Feeding Rate (% of Body Weight/Day) |
|---|---|
| Fingerling | 5–8% |
| Juvenile | 3–5% |
| Grower | 2–3% |
| Finisher | 1–2% |
Worked calculation. A pond stocked with 2,000 grower-stage fish averaging 150 g each has a total biomass of 300 kg. At a 2.5% feeding rate:
Daily feed requirement = 300 kg × 2.5% = 7.5 kg/day
This figure should be recalculated every 2–3 weeks based on a sample weighing (netting and weighing a representative sample of 20–30 fish, not assuming growth based on time elapsed alone), since actual growth rate varies with water temperature, stocking density, and feed quality — a farm feeding against a stale biomass estimate is either overfeeding (wasting money and degrading water quality) or underfeeding (suppressing achievable growth) without realizing it.
Feeding Frequency and Timing
| Growth Stage | Feeds per Day |
|---|---|
| Fingerling | 3–5 |
| Juvenile | 3 |
| Grower | 2–3 |
| Finisher | 2 |
More frequent, smaller feedings improve feed utilization at early life stages because fingerlings have small stomach capacity and limited ability to process a large single meal — spreading the same daily total across more feedings reduces waste and improves growth consistency.
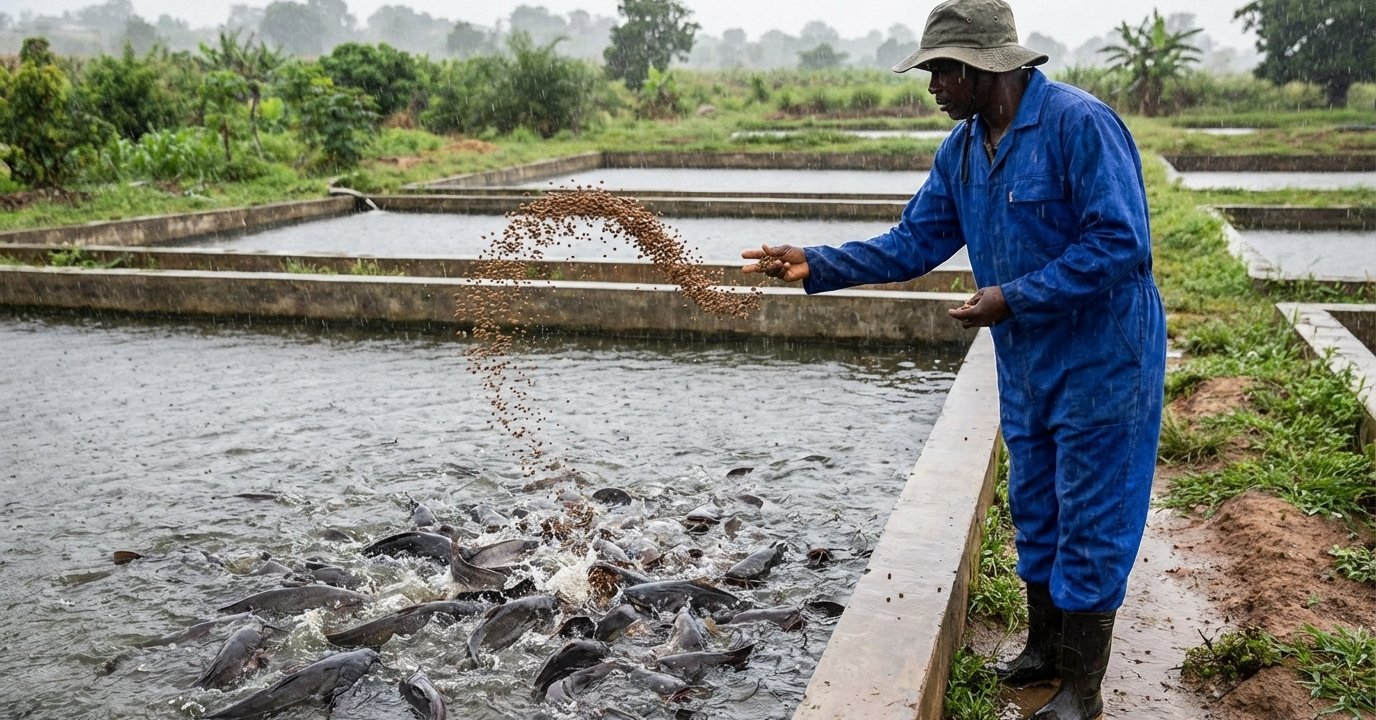
Recommended feeding windows: early morning (approximately 8:00–10:00 a.m.) and late afternoon (approximately 4:00–6:00 p.m.), when water temperature and dissolved oxygen levels support active feeding behavior. Avoid feeding during the hottest part of the afternoon, when oxygen levels are typically at their lowest and fish feeding response drops — feed offered during this window is more likely to go uneaten and foul the water. Avoid feeding immediately before or during heavy rainfall, which can cause rapid oxygen depletion and stress that suppresses feeding response regardless of feed quality.
The Four Feeding Mistakes That Cost Farmers the Most
Overfeeding. The most expensive and most common error. Uneaten feed does not simply represent wasted cost — it decomposes in the pond, consuming dissolved oxygen and elevating ammonia, which stresses fish, suppresses growth, and increases disease susceptibility. A pond showing declining water clarity, increased surface gasping (a sign of low dissolved oxygen), or unusual mortality should have its feeding rate reviewed before any other diagnostic step, since overfeeding is frequently the root cause behind problems that appear to be disease or water quality issues on the surface.
Using poor-quality or inconsistently formulated feed. Feed that does not deliver its stated protein content, or that varies in quality batch to batch, produces exactly the symptoms of underfeeding — slow growth, poor FCR, weakened immune response — even when the quantity fed matches the guidelines above. A farm experiencing unexplained FCR deterioration despite following correct feeding rates should verify feed quality (checking for consistent pellet appearance, absence of mold or off-odor, and where possible, supplier quality documentation) before assuming the problem is a management error.
Inconsistent feeding schedule. Catfish, like most farmed species, perform best under predictable routine — irregular feeding times produce a stress response that measurably reduces feed conversion efficiency compared to fish fed at consistent times daily, independent of the total quantity or quality of feed provided.
Failing to adjust pellet size to fish size. Feed pellet size should increase in step with fish growth. Undersized pellets fed to larger fish require excessive feeding effort relative to nutritional intake and are frequently under-consumed; oversized pellets fed to smaller fish may be difficult to ingest at all, effectively wasting the feed entirely.
Signs of Correct vs. Poor Feeding Management
| Well-Fed Pond | Poorly-Fed Pond |
|---|---|
| Active, competitive feeding response at each feeding | Sluggish or absent feeding response |
| Uniform growth across the sampled population | Wide size variation within the same cohort |
| Smooth skin, no visible lesions | Rough skin, visible stress marks |
| Low, stable mortality rate | Elevated or rising mortality |
| Clear water with stable dissolved oxygen | Cloudy water, surface gasping, ammonia odor |
Cost Discipline: Feed Efficiency as the Primary Profit Lever
Because feed represents 60–70% of total production cost, a farm’s realistic path to improved profitability runs primarily through FCR improvement, not through revenue-side price negotiation alone. The following practices, applied consistently, are what separate farms achieving the 1.0–1.3 FCR range from farms operating above 1.7:
- Use quality floating feed from a verified, consistent supplier rather than switching suppliers based on short-term price differences
- Recalculate feeding quantity against actual sampled biomass every 2–3 weeks, not against assumed growth
- Feed at the same times daily, within the recommended morning and late-afternoon windows
- Observe feeding response at every feeding and adjust the next feeding’s quantity if uneaten feed is visible
- Remove uneaten feed where practical, rather than allowing it to decompose in the pond
- Test water quality (dissolved oxygen, ammonia, pH) on a regular schedule, since water quality deterioration and feeding inefficiency compound each other
- Store feed in a dry, pest-free environment — moisture-damaged or contaminated feed loses nutritional value and can introduce toxins even when it appears visually intact
Farmers who apply this level of feeding discipline consistently report profitability improvements in the range of 30–40% compared to farms feeding on an ad hoc, unmeasured basis — not because the fish are fundamentally different, but because every kilogram of feed purchased is converted into sellable fish weight at a substantially higher rate.
Frequently Asked Questions
How many times should catfish be fed daily? Fingerlings 3–5 times, juveniles 3 times, growers 2–3 times, and finishers 2 times daily, with quantity split evenly across feedings.
What is the best feed type for catfish? Floating feed, because it allows direct monitoring of consumption, reduces water pollution from uneaten feed, and provides an early warning signal (reduced feeding response) for underlying health or water quality problems.
How much should catfish be fed per day? As a percentage of total pond biomass: fingerlings 5–8%, juveniles 3–5%, growers 2–3%, finishers 1–2% — recalculated every 2–3 weeks against sampled, not assumed, growth.
What happens if catfish are overfed? Uneaten feed decomposes, depleting dissolved oxygen and raising ammonia levels, which increases disease susceptibility and mortality risk while also directly wasting feed cost.
What protein level do catfish need at each stage? Fingerlings 40–45%, juveniles 35–40%, growers 28–32%, finishers 25–28%, declining as the fish matures and its energy-to-protein requirement shifts.
Keywords: catfish feeding guide, catfish FCR, catfish protein requirements, floating feed catfish, catfish feeding rate calculation, catfish feeding schedule, catfish farming profitability, catfish feed conversion ratio, catfish overfeeding, catfish feed management, commercial catfish farming, catfish grower finisher feeding