Feed conversion ratio (FCR) is the most financially consequential single metric in commercial catfish farming. At XAF 600 per kilogram of feed and a target of 50 tonnes of fish per year, the difference between FCR 1.4 and FCR 1.8 is XAF 14,400,000 in additional feed cost annually — from the same number of fish, in the same tanks, with the same labor, infrastructure, and market relationships. No other single operational parameter has an equivalent financial impact on the same cost base, which is why understanding what determines FCR and how to manage the factors within the farm’s control is the most financially productive analytical investment a catfish operation can make.
FCR is simultaneously a simple calculation and a complex system outcome. The calculation is straightforward — kilograms of feed delivered divided by kilograms of fish weight gained. The system that determines the result includes feed quality (digestibility, amino acid profile, energy density), water quality (which affects metabolic efficiency), health status (which affects the energy that goes to immune response rather than growth), stocking density (which affects competitive feeding behavior and stress), and — most directly manageable by the farm — the feeding schedule and feeding rate management that determine how much feed reaches the fish in a form and at a time and rate where it can be digested and utilized.
This article covers FCR calculation methodology, the diagnostic framework for understanding what is driving FCR in a specific operation, and the specific feeding schedule parameters — daily ration, feeding frequency, feeding time, feeding method — that the farm manager controls directly and that together determine whether the operation achieves the FCR that the feed specification and fish genetics allow or falls consistently short of it.
FCR Calculation — Methodology and Common Errors
The Basic FCR Formula
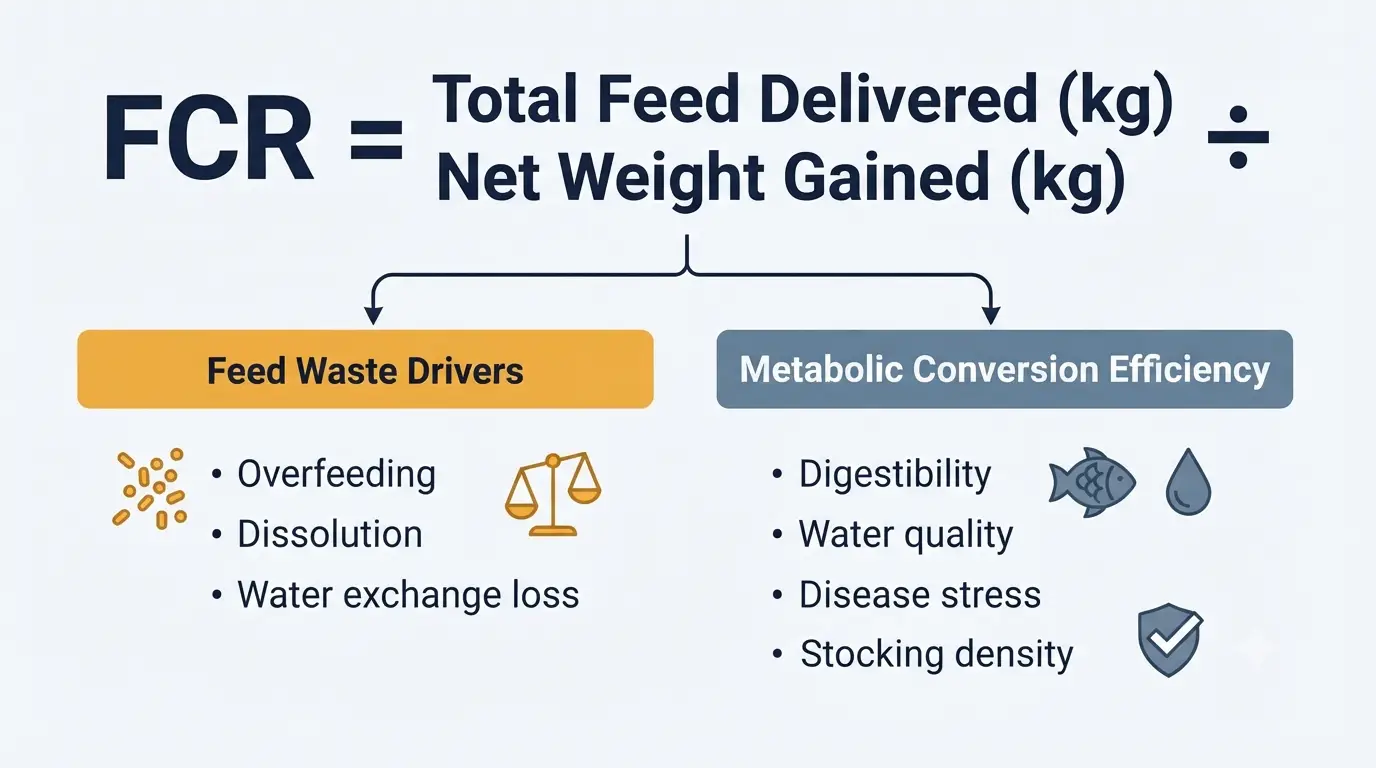
FCR = Total feed delivered (kg) ÷ Net weight gained (kg)
Where:
- Total feed delivered = the sum of all feed weighed and delivered to the production unit (tank, pond, or group) during the measurement period
- Net weight gained = (Final average weight × Final number of fish) − (Initial average weight × Initial number of fish)
Example calculation:
A concrete tank stocked with 500 fingerlings averaging 10 g (initial biomass = 500 × 0.010 = 5.0 kg) over 90 days:
- Total feed delivered: 135 kg
- Final count: 475 fish (25 mortalities during the period)
- Final average weight: 320 g
- Final biomass: 475 × 0.320 = 152 kg
- Net weight gained: 152 − 5 = 147 kg
- FCR = 135 ÷ 147 = 0.92
This seems very good — in fact, this FCR appears too low for African catfish, which indicates a calculation error. Review:
The most common FCR calculation errors:
Error 1: Not accounting for feed to dead fish: Fish that die during the production period consumed feed before dying — this feed contributed to their body mass accumulation, but that body mass was lost when they died. The feed fed to dead fish did not produce market fish, but it was consumed. The “net weight gained” calculation above only accounts for the weight of surviving fish, while the feed total includes feed consumed by both survivors and mortalities. For low mortality operations (below 5%), this error is small. For high mortality operations (above 15%), it can significantly understate the true FCR.
The correction for mortality: Adjusted net weight gained = (Final biomass of survivors) + (Estimated biomass of dead fish at time of death) − Initial biomass
For simplicity, assume dead fish died at their average weight halfway through the production period: Estimated dead fish biomass at death: 25 fish × (10 g + 320 g) ÷ 2 = 25 × 165 g = 4.1 kg Corrected net weight gained: 147 + 4.1 = 151.1 kg Corrected FCR = 135 ÷ 151.1 = 0.89 (marginally lower — mortality correction matters more at high mortality rates)
Error 2: Not weighing feed delivered — estimating from bag count instead: A 25 kg bag of feed that is 90% full at the start of the period and was purchased from a supplier whose bags are sometimes light contributes less than 25 kg to the ration. Feed must be weighed, not estimated from bag count, for accurate FCR calculation.
Error 3: Not measuring fish weights — using stocking records only: Fish growth does not proceed at a uniform rate — it accelerates in periods of favorable conditions and slows in periods of stress, disease, or suboptimal temperature. Using the initial stocking weight plus a projected growth rate to estimate final weight without actually weighing fish produces FCR calculations that reflect assumptions rather than actual performance.
Error 4: Including feed from different periods in the measurement: Feed delivered before the measurement start date or after the harvest date must be excluded. Feeding of newly stocked fingerlings in the 48 hours before they begin consuming normally is sometimes included in a period calculation that uses the initial weight measured before feeding began — inflating the numerator without a corresponding biomass effect in the denominator.
FCR Measurement Frequency
For production management purposes, calculate FCR at minimum monthly — not just at harvest. Monthly FCR tracking provides the trend data that identifies performance deterioration before the end-of-cycle calculation reveals a problem that has been developing for months:
Monthly FCR calculation protocol:
- At the start of each month: weigh a representative sample of 30–50 fish from each production unit to establish average weight
- Through the month: record all feed deliveries to each unit by weight
- At the end of the month: weigh another sample of 30–50 fish
- Calculate: FCR = Monthly feed delivered ÷ (End average weight − Start average weight) × (Fish number at end of month)
A monthly FCR that is 20% above target warrants immediate investigation — water quality check, health assessment, and feeding management review — rather than waiting until harvest to discover that three months of above-target FCR has significantly increased feed cost for the entire production cycle.
What Determines FCR — The Diagnostic Framework
The FCR Component Tree
FCR variation in a catfish operation originates from a limited number of identifiable causes. Understanding which component is responsible for an above-target FCR determines the correct intervention:
FCR = Feed consumed by fish ÷ Weight gained by fish
Feed consumed by fish ≠ Feed delivered to the system:
Delivered feed that is not consumed by fish — whether it dissolves in the water (from poor water stability), settles uneaten to the bottom, or is washed out with water exchange before fish locate it — does not contribute to fish growth but is counted in the feed delivery numerator. Feed waste between delivery and consumption is the most direct and most easily corrected cause of above-target FCR.
Weight gained per unit of feed consumed is determined by:
- Digestibility of the feed: What proportion of consumed feed is absorbed — as covered in the previous two articles, this is primarily determined by feed processing quality
- Metabolic efficiency: What proportion of absorbed nutrients is allocated to growth vs. maintenance metabolism and immune response — determined by water quality, health status, temperature, and stress level
- Basal maintenance requirement: The minimum metabolic cost of keeping the fish alive regardless of growth — lower in larger fish (as a proportion of total metabolic cost) and higher in cold temperatures (where the temperature-growth relationship means more metabolic cost per unit of growth)
The Five Primary Causes of Above-Target FCR
Cause 1: Feed waste (most common)
Uneaten, lost, or dissolved feed that is counted in delivered quantity but does not reach the fish’s digestive system. Sources include:
- Overfeeding above the fish’s actual appetite and digestive capacity
- Poor feed water stability causing pellet breakdown before fish consume it
- Feed delivered to areas of the pond or tank where fish are not feeding
- Feed stolen by birds, turtles, frogs, or other non-target species accessing the production system
Diagnostic indicator: FCR substantially above what the fish’s growth rate would predict if feed consumption were 100% efficient — often detectable by observing uneaten feed at the surface 30 minutes after feeding, or by elevated turbidity from dissolved feed particles.
Cause 2: Water quality stress
Fish under chronic water quality stress — suboptimal dissolved oxygen, elevated ammonia or nitrite, inappropriate temperature — allocate a higher proportion of consumed energy to physiological stress response (cortisol production, osmoregulatory work, immune maintenance) and a lower proportion to growth. The fish eats the same amount but grows more slowly.
Diagnostic indicator: FCR worsening coincides with a measurable water quality parameter exceedance; FCR improvement follows water quality correction without other management change.
Cause 3: Disease and health status
Active disease (bacterial, parasitic, or viral infection) diverts metabolic resources to immune response, inflammatory response, and tissue repair. Even subclinical disease — where clinical signs are absent or subtle — can reduce growth rate by 10–20% through immune activation costs.
Diagnostic indicator: FCR worsening occurs without identifiable water quality or feeding management change; elevated background mortality accompanies the FCR increase; fish appear less vigorous or responsive to feeding stimulation than normal.
Cause 4: Feed quality
Feed that has been stored too long (degraded vitamins, oxidized fats), adulterated by the manufacturer, or formulated with lower-digestibility ingredients than the specification states — produces lower growth per unit of delivered feed than the specification predicts.
Diagnostic indicator: FCR worsens with a new feed batch from the same supplier, or after a period when the same feed has been held in storage for an extended period. FCR returns toward target when a fresh batch of the same or alternative feed is introduced.
Cause 5: Overcrowding and competitive feeding
At excessively high stocking density, dominant fish consume a disproportionate share of the ration while subordinate fish receive insufficient feed. The overall tank FCR appears acceptable (or even good) while some fish are growing rapidly and others are growing very slowly or not at all. This pattern produces excessive size variation at harvest and the cannibalism and mortality that accompanies it.
Diagnostic indicator: High size variation within a cohort that was uniform at stocking; some individual fish very large while many are very small; apparent “average” FCR masks the fact that a large proportion of the batch has poor actual FCR.
The Feeding Schedule — The Primary Management Lever
What the Feeding Schedule Controls
The feeding schedule is the primary management variable within the farm manager’s direct daily control. A correctly designed feeding schedule delivers the right total daily ration, at the right feeding rate per session, at the right times of day, in the right manner for the production system — maximizing feed intake and minimizing feed waste simultaneously.
The four parameters of the feeding schedule:
- Daily ration (% of biomass per day): The total feed quantity allocated per day as a percentage of the current fish biomass
- Feeding frequency: The number of times per day feed is delivered
- Feeding time: When during the day each feed delivery occurs
- Feeding method: How feed is delivered to the fish (hand broadcast, automatic feeder, demand feeder)
Each parameter has an optimum that is not constant — it changes with fish size, water temperature, health status, and production stage. A feeding schedule that is optimal for 50 g fish at 28°C is suboptimal for the same fish at 200 g or at 24°C.
Daily Ration — The Foundation of Feeding Management
Calculating the Correct Daily Ration
The daily ration (expressed as percentage of biomass per day, or %BW/day) is the quantity of feed that provides the fish’s full voluntary appetite without excess. At or below voluntary appetite, each additional increment of feed produces proportional additional growth — FCR remains approximately constant. Above voluntary appetite, additional feed is wasted — FCR rises because more feed delivers no additional growth.
Reference daily ration by size and temperature (African catfish, floating feed, 35–40% CP):
| Fish Weight | Water Temp 24°C | Water Temp 27°C | Water Temp 30°C |
|---|---|---|---|
| 1–5 g | 8–10% BW/day | 10–15% BW/day | 12–18% BW/day |
| 5–20 g | 6–8% BW/day | 8–10% BW/day | 10–12% BW/day |
| 20–50 g | 4–6% BW/day | 6–8% BW/day | 7–9% BW/day |
| 50–150 g | 3–5% BW/day | 4–6% BW/day | 5–7% BW/day |
| 150–300 g | 2.5–4% BW/day | 3–5% BW/day | 4–6% BW/day |
| 300–500 g | 2–3% BW/day | 2.5–4% BW/day | 3–4.5% BW/day |
| Above 500 g | 1.5–2.5% BW/day | 2–3% BW/day | 2.5–3.5% BW/day |
Calculating daily ration for a specific tank:
Step 1: Estimate current average fish weight (from last sample weighing) Step 2: Estimate current fish count (stocked number minus estimated mortality) Step 3: Calculate current estimated biomass (average weight × count) Step 4: Apply the appropriate %BW/day from the table Step 5: Calculate daily ration in grams
Example:
- Average weight: 150 g
- Count: 480 fish
- Biomass: 480 × 0.150 kg = 72 kg
- Daily ration at 3.5% BW/day (28°C): 72 × 0.035 = 2.52 kg/day
Update the calculation monthly (minimum) as the biomass increases with growth — a feeding rate calculated on Month 1 biomass will significantly underfeed by Month 3 if the biomass has doubled. Monthly weighing samples provide the biomass update that keeps the daily ration calibrated to actual fish size rather than stocking weight.
The Satiation Feeding Alternative
Rather than calculating a fixed daily ration from %BW/day tables, satiation feeding delivers feed until fish stop eating — feeding each session until no further active consumption is visible at the surface or until feed settles without being consumed.
Advantages of satiation feeding:
- Self-correcting for temperature, health status, and appetite variation — when fish are eating less due to any cause, the satiation observation stops feeding before the fixed ration amount causes overfeeding
- Does not require accurate biomass estimates — removes the calculation uncertainty of fixed-ration feeding
Disadvantages of satiation feeding:
- Requires an experienced observer to correctly identify the end of the satiation feeding window — an observer who stops too early leaves growth potential unfulfilled; one who stops too late allows feed waste and water quality deterioration
- Labor-intensive — each satiation feeding requires a person present throughout the feeding event
- Difficult to standardize between different staff members — the satiation endpoint is a judgment call that varies between observers
Best application of satiation feeding: For operations with skilled, consistent feeding staff where biomass estimation is difficult (large earthen ponds with uncertain fish counts), satiation feeding reduces overfeeding waste better than a fixed ration calculated from uncertain biomass estimates.
The Apparent Feeding Rate — Watching Fish Behavior to Adjust Ration
Between formal monthly weighing cycles, the fish’s own feeding behavior provides a daily indicator of whether the current ration is appropriate, insufficient, or excessive:
Signs of correct ration:
- Fish consume the full ration within 15–25 minutes of the last delivery
- Feeding activity is vigorous throughout the feeding window
- No visible uneaten feed floating at the surface 30 minutes after feeding ends (for floating feed)
Signs of insufficient ration:
- Fish continue actively seeking feed for more than 30 minutes after all ration has been consumed
- Fish are competing aggressively for feed with more pushing and chasing than usual
- Fish approach the feeding area before the scheduled feeding time
Signs of excessive ration:
- Uneaten feed visible at the surface 30 minutes after the scheduled feeding window ends
- Feeding activity declines significantly before the full calculated ration has been delivered
- Water quality parameters (turbidity, ammonia, DO) deteriorating faster than expected for the current biomass
When behavioral signs indicate insufficient or excessive ration, adjust the daily quantity by 10–15% in the indicated direction rather than waiting for the next scheduled biomass assessment.
Feeding Frequency — How Many Times Per Day?
The Biological Basis for Feeding Frequency
Fish are poikilothermic (ectothermic) — their digestive enzyme activity and gut passage rate are temperature-dependent. At 28°C, African catfish have a gut transit time of approximately 4–6 hours for a typical commercial meal — meaning that the gut is essentially cleared and ready for another meal every 4–6 hours. Feeding more frequently than this does not improve digestion — it potentially causes chronic gut fill that suppresses appetite and reduces feed intake per session.
Feeding frequency by production stage:
| Production Stage | Fish Weight | Recommended Frequency | Rationale |
|---|---|---|---|
| Larvae | 0.002–0.1 g | Every 2–4 hours | Very fast metabolism; small stomach capacity; critical growth window |
| Early fingerling | 0.1–1 g | 6–8 times/day | High metabolic rate; frequent small meals maximize intake |
| Late fingerling | 1–10 g | 4–6 times/day | Digestive capacity increasing; reduce to match gut transit time |
| Juvenile grow-out | 10–100 g | 3–4 times/day | Standard grow-out frequency |
| Grower | 100–300 g | 2–3 times/day | Gut transit time allows 3 meals per day |
| Finisher | 300 g–market | 2 times/day | Larger stomach capacity; 2 meals/day sufficient |
| Broodstock | Adult | 2 times/day | Maintenance and reproductive conditioning |
The economic rationale for reducing feeding frequency in larger fish:
Feeding frequency has a direct labor cost — each feeding event requires a person to deliver feed, observe feeding behavior, and record consumption. Reducing feeding frequency from 4 times/day to 2 times/day for finisher-stage fish cuts the feeding labor cost by 50% without impairing fish growth, since the fish’s gut transit time and stomach capacity at 300+ g can accommodate a larger meal at each of two daily feedings.
Feeding Times — When During the Day to Feed
Temperature-Adjusted Timing
In West and Central Africa, where ambient temperatures produce water temperature peaks in early afternoon (1:00–3:00 PM) and troughs in early morning (5:00–7:00 AM), the daily water temperature cycle creates a corresponding feeding response cycle:
Coolest periods of the day (early morning and evening): African catfish show strongest feeding response and highest feed conversion efficiency — temperatures are within or close to the optimal range, metabolic efficiency is high, and the overnight fasting period has maximized appetite
Hottest periods (11:00 AM–3:00 PM in most locations): Catfish feeding response is suppressed by elevated temperature; digestive efficiency declines; the metabolic cost of thermoregulation reduces the net energy available for growth from each meal
Recommended feeding schedule:
| Feeding | Recommended Time | Rationale |
|---|---|---|
| First feeding | 6:00–7:00 AM | Coolest water of the day; maximum appetite after overnight fast; allows full observation in daylight |
| Second feeding | 10:00–11:00 AM | Before peak midday heat; at least 4 hours after first feeding |
| Third feeding (if 3 meals/day) | 4:00–5:00 PM | After peak afternoon heat; second coolest period of the day |
| Evening feeding (if 4 meals/day) | 7:00–8:00 PM | Aligns with natural nocturnal activity peak; good feeding response |
Avoiding midday feeding during hot season:
In the hottest months (typically February–April and November–December in much of the Sahel and Guinea zones; year-round hot conditions in coastal lowlands), water temperatures in open concrete tanks can reach 32–35°C between 12:00 and 3:00 PM. A midday feeding during these peak temperature hours is often largely wasted — the fish’s appetite is suppressed and feed conversion is poor. Moving midday rations to the morning and evening feeds is a simple schedule adjustment that can improve FCR measurably during hot periods without requiring any other change.
Synchronizing Feeding with Water Exchange
In concrete tank systems with regular water exchange, the timing of water exchange relative to feeding affects how much of the added feed is retained in the tank for fish consumption:
Avoid feeding immediately before or during a large water exchange event:
If 20–30% of tank water is exchanged by opening the outlet valve, any floating feed on the surface at that time may be carried out with the outflowing water. Feed at least 20–30 minutes before the exchange begins, or wait until the exchange is complete and the inflow has replaced the outflow before delivering the next ration.
Water exchange timing relative to feeding:
Optimal: Exchange water 1 hour after feeding, when floating feed has been consumed, and any residual particles have settled; the exchange then removes the dissolved nutrient products of digestion (ammonia, CO₂) rather than removing unconsumed feed.
Suboptimal: Continuous high-rate exchange running simultaneously with feeding — this continuously flushes incoming feed from the tank surface along with outflowing water before fish can consume it.
Feeding Methods — Delivery Mechanism and Its Impact on FCR
Hand Broadcast Feeding
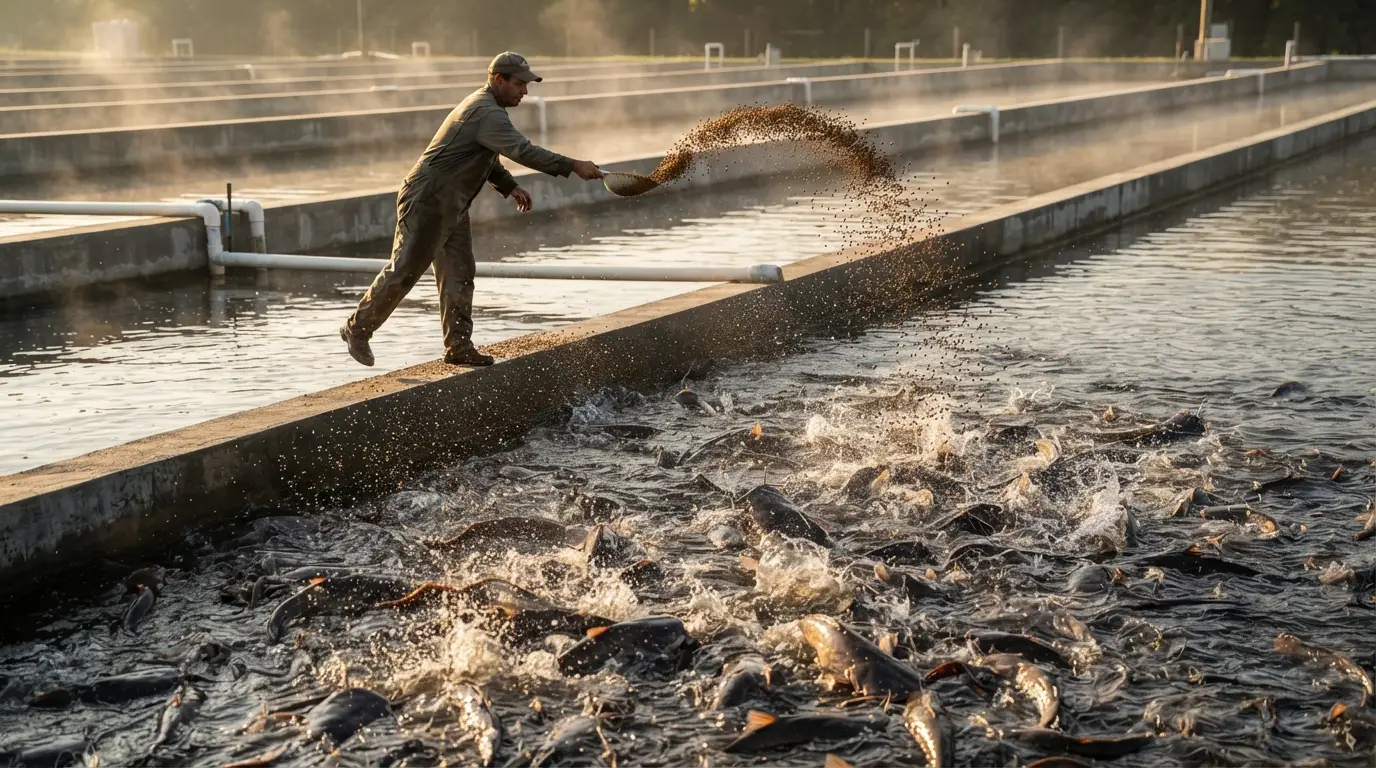
The most common feeding method in West African commercial catfish operations — the farm manager or feeding staff walks along the tank edge or pond bank, casting handfuls of feed across the water surface.
Advantages:
- No capital cost for equipment
- Allows simultaneous observation of feeding response, fish behavior, and apparent health
- Flexible — delivery rate and pattern can be adjusted in real time based on observed fish response
FCR impact of poor hand broadcasting technique:
Clumping: Casting large handfuls at once creates a concentrated pile of feed at one location — fish crowd to this area, some consume excess amounts while others cannot access the feed, and the concentrated feed pile depletes oxygen locally as it dissolves. Correct technique broadcasts in a thin, even spread across the entire tank or feeding area surface.
Inconsistency: Different staff members broadcast at different rates, at different coverage patterns, and spend different amounts of time observing — producing inconsistent feed delivery that cannot be reconstructed from records and makes FCR variation difficult to diagnose.
Frequency: Hand broadcasting requires the physical presence of the feeder throughout the feeding session — a practical constraint on feeding frequency in operations with limited staffing.
Demand Feeders (Self-Feeders)
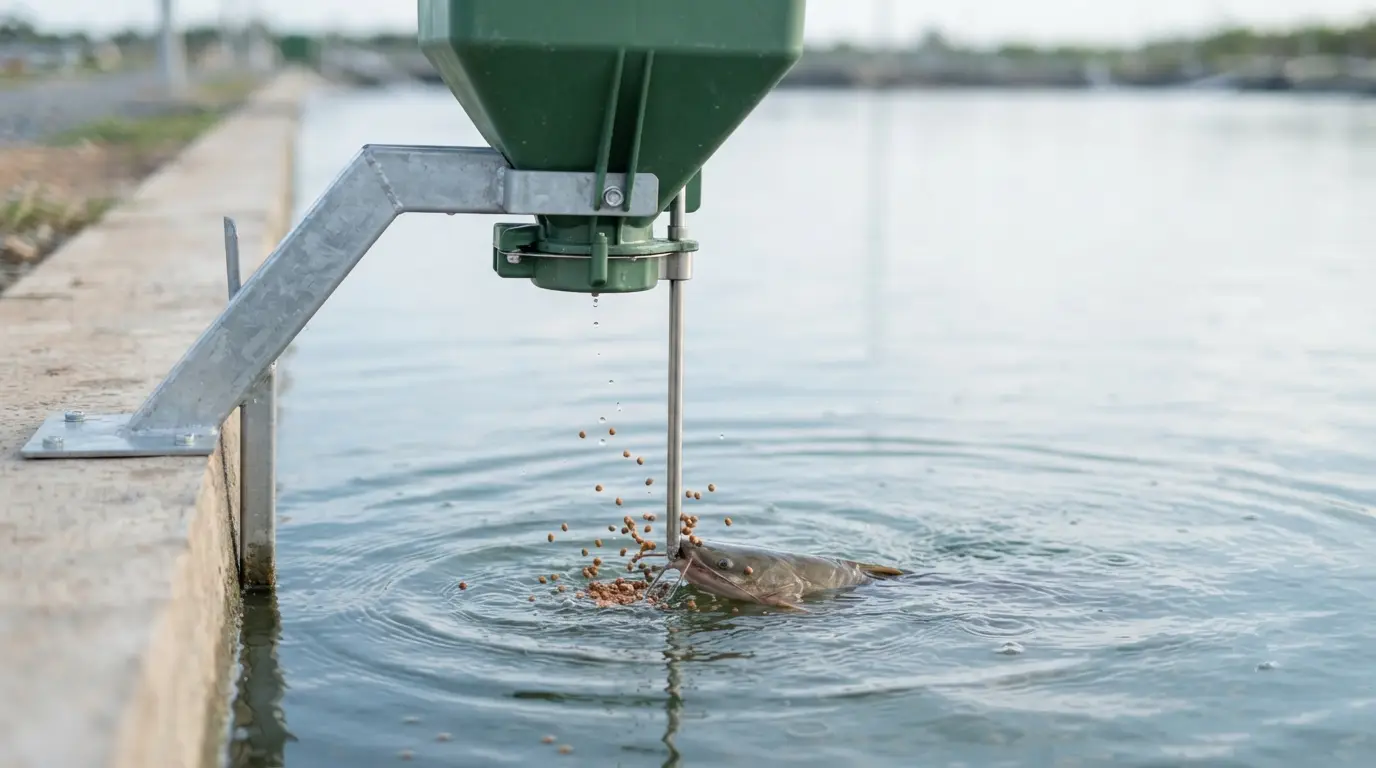
A demand feeder is a feed dispensing device triggered by the fish themselves — a rod or paddle hanging into the water column is struck or bumped by fish, releasing a small quantity of feed with each activation. The fish learn to operate the feeder within days of introduction, and feed is delivered on demand throughout the day and night.
FCR advantages of demand feeders:
Self-regulating ration: Fish consume as much as they want and stop operating the feeder when satiated — automatic satiation feeding without requiring staff presence. This eliminates the overfeeding that occurs when staff continues delivering the calculated ration after fish have become satiated.
24-hour feeding opportunity: African catfish naturally prefer nocturnal feeding — demand feeders allow the fish to feed at their preferred times, including overnight, without staff presence. Studies with demand-fed catfish typically show 10–15% better FCR compared to scheduled hand broadcast feeding — attributed to better alignment between feed delivery and peak appetite periods.
Feed waste reduction: Demand feeders dispense small quantities per activation — typically 5–30 g per trigger event — rather than the larger amounts broadcast in hand feeding. This small, frequent delivery better matches the fish’s intake capacity per feeding bout.
Demand feeder limitations:
Equipment cost: Simple demand feeders cost XAF 15,000–50,000 (USD 25–83) per unit — manageable for most operations, particularly when the FCR improvement is quantified
Maintenance: Feed in the hopper must be kept dry (humid stored feed clumps and blocks the dispensing mechanism); the triggering mechanism must be checked regularly; the hopper must be refilled on a schedule that does not allow it to run empty (fish that find an empty demand feeder lose the conditioned response and FCR suffers during the reconditioning period)
Automatic Timed Feeders
Automatic feeders dispense a calibrated quantity of feed at programmed intervals — controlled by a timer that activates a rotating disc or auger to release feed at the specified times and quantities.
FCR advantages:
Consistency: Identical ration delivered at identical intervals regardless of staff availability or scheduling variation — eliminating the day-to-day feeding variability that makes FCR interpretation difficult
Frequency capability: Can feed 6–8 times per day for fingerlings or larvae without requiring proportionally more staff time — one staff member checks and refills multiple automatic feeders rather than hand broadcasting at each feeding
Limitation: Automatic feeders deliver a fixed ration regardless of fish appetite — if fish are not eating normally (due to water quality, health, or temperature), the fixed ration becomes overfeeding. They lack the satiation-responsive adjustment of demand feeders and the real-time observation capability of hand broadcasting.
Building the FCR Improvement Plan
Benchmarking Current FCR
Before implementing FCR improvement measures, establish accurate current FCR through the rigorous calculation methodology in Part 1 — ensuring the feed quantity is measured accurately, the biomass is weighed rather than estimated, and the calculation period is sufficiently long (minimum 30 days) to smooth day-to-day variation.
FCR benchmarks for African catfish commercial production:
| Management Category | FCR Range | Characterization |
|---|---|---|
| Excellent | 1.2–1.4 | Optimized feeding management, high feed quality, good water quality |
| Good | 1.4–1.6 | Above-average management, commercial feed quality |
| Average | 1.6–1.9 | Typical commercial management quality |
| Below average | 1.9–2.4 | Identifiable management or water quality problems |
| Poor | Above 2.5 | Significant feed waste, chronic water quality stress, or disease |
The FCR Improvement Priority Sequence
When FCR is above target, implement improvements in the following priority sequence (highest leverage first):
Priority 1 — Eliminate feed waste: Before addressing any other factor, verify that all feed delivered is actually reaching and being consumed by fish. This is the highest-leverage, lowest-cost improvement available. Methods: observe floating feed 30 minutes after feeding; protect feeding area from bird access; verify water exchange timing does not flush feed.
Priority 2 — Optimize water quality: If feed waste is not the issue, check all water quality parameters against the targets established in the water quality articles. Even marginal water quality compromise produces measurable FCR impact — correct the specific parameter out of range rather than implementing all water quality interventions simultaneously.
Priority 3 — Review feeding schedule: Compare current daily ration against the %BW/day reference for current fish size and temperature; verify feeding timing avoids peak heat; assess whether feeding frequency is appropriate for the current production stage.
Priority 4 — Assess feed quality: Test a new batch of feed against the current batch if FCR worsened with a batch change; check manufacture date and storage conditions; consider a parallel comparison with an alternative feed product.
Priority 5 — Health investigation: If FCR improvement is not achieved after addressing priorities 1–4, initiate a health investigation — gill sampling for parasites, observation for behavioral disease signs, veterinary consultation for disease differential diagnosis.
Summary
FCR is the integration of every management decision made in the catfish grow-out operation — the feed quality purchasing decision, the water quality management discipline, the health management program, and the feeding schedule precision all express themselves in the FCR that the monthly calculation reveals.
The feeding schedule is the most directly controllable FCR lever available to the farm manager daily: daily ration calibrated monthly to current biomass and temperature, feeding frequency matched to fish size and gut transit time, feeding times avoiding peak temperature stress periods and aligning with natural appetite peaks, and feeding method (hand broadcast vs. demand feeder vs. automatic feeder) matched to the management capability and production scale of the operation.
The farm that measures FCR accurately and monthly, diagnoses above-target FCR through the causal framework in this guide rather than accepting it as unexplained variation, and implements the specific corrective intervention that addresses the identified cause — that farm systematically reduces its feed cost per kilogram of fish produced over time. The farm that does not measure FCR accurately discovers its true feed cost only at the end-of-cycle financial reconciliation, when the opportunity to correct it has passed.
The next cluster covers the health management of commercial catfish — beginning with the identification and treatment of common bacterial and viral infections.